× Cluster Scenario CO2 Sources Pipeline Transport Ship Transport Injection Storage Recommendations


About Legal Notice Privacy Policy


CCSCarbon Dioxide Capture and Storage ClusterCluster = Short name of our project.
In the project‘s CCS cluster scenario, we consider a regional cluster of CO2 emitters whose captured CO2 streams are fed in pipeline network totalling 19.7 Mio t per year.
ScenarioIn the project’s CCS cluster scenario, CO2 streams are fed in a pipeline collection network and then transported by a trunk line (onshore and offshore sections) for offshore geological storage

red red red red
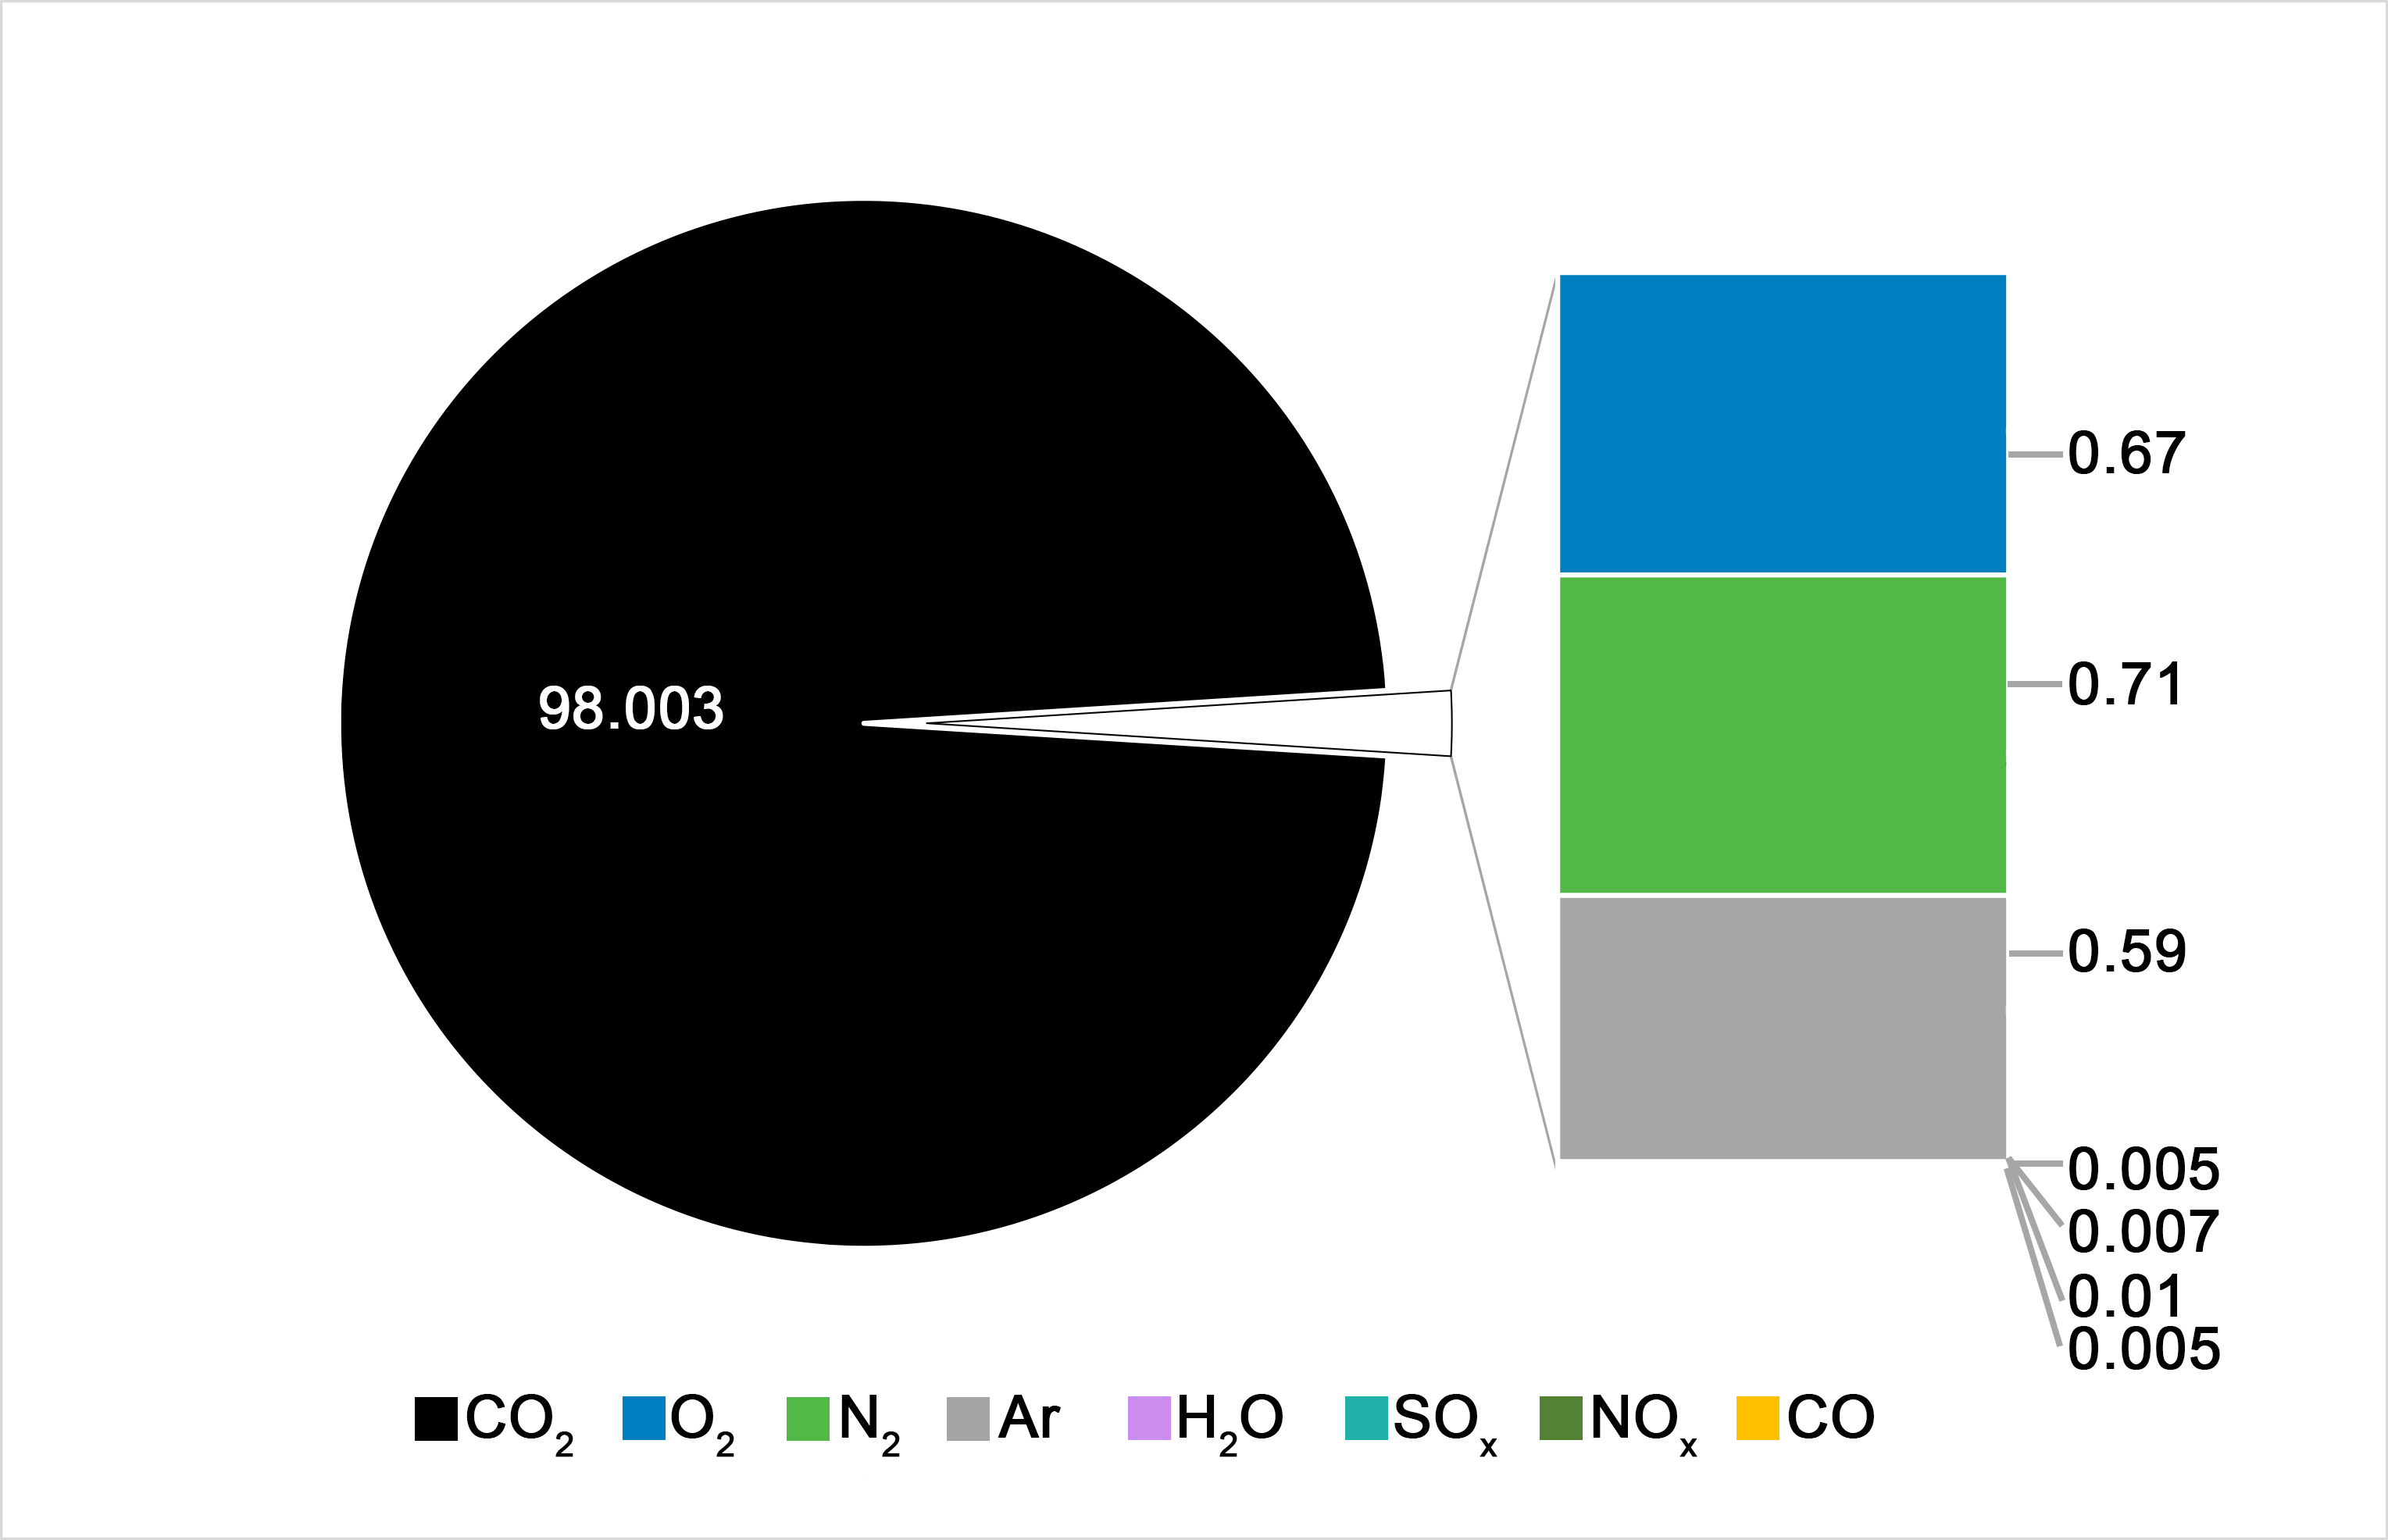
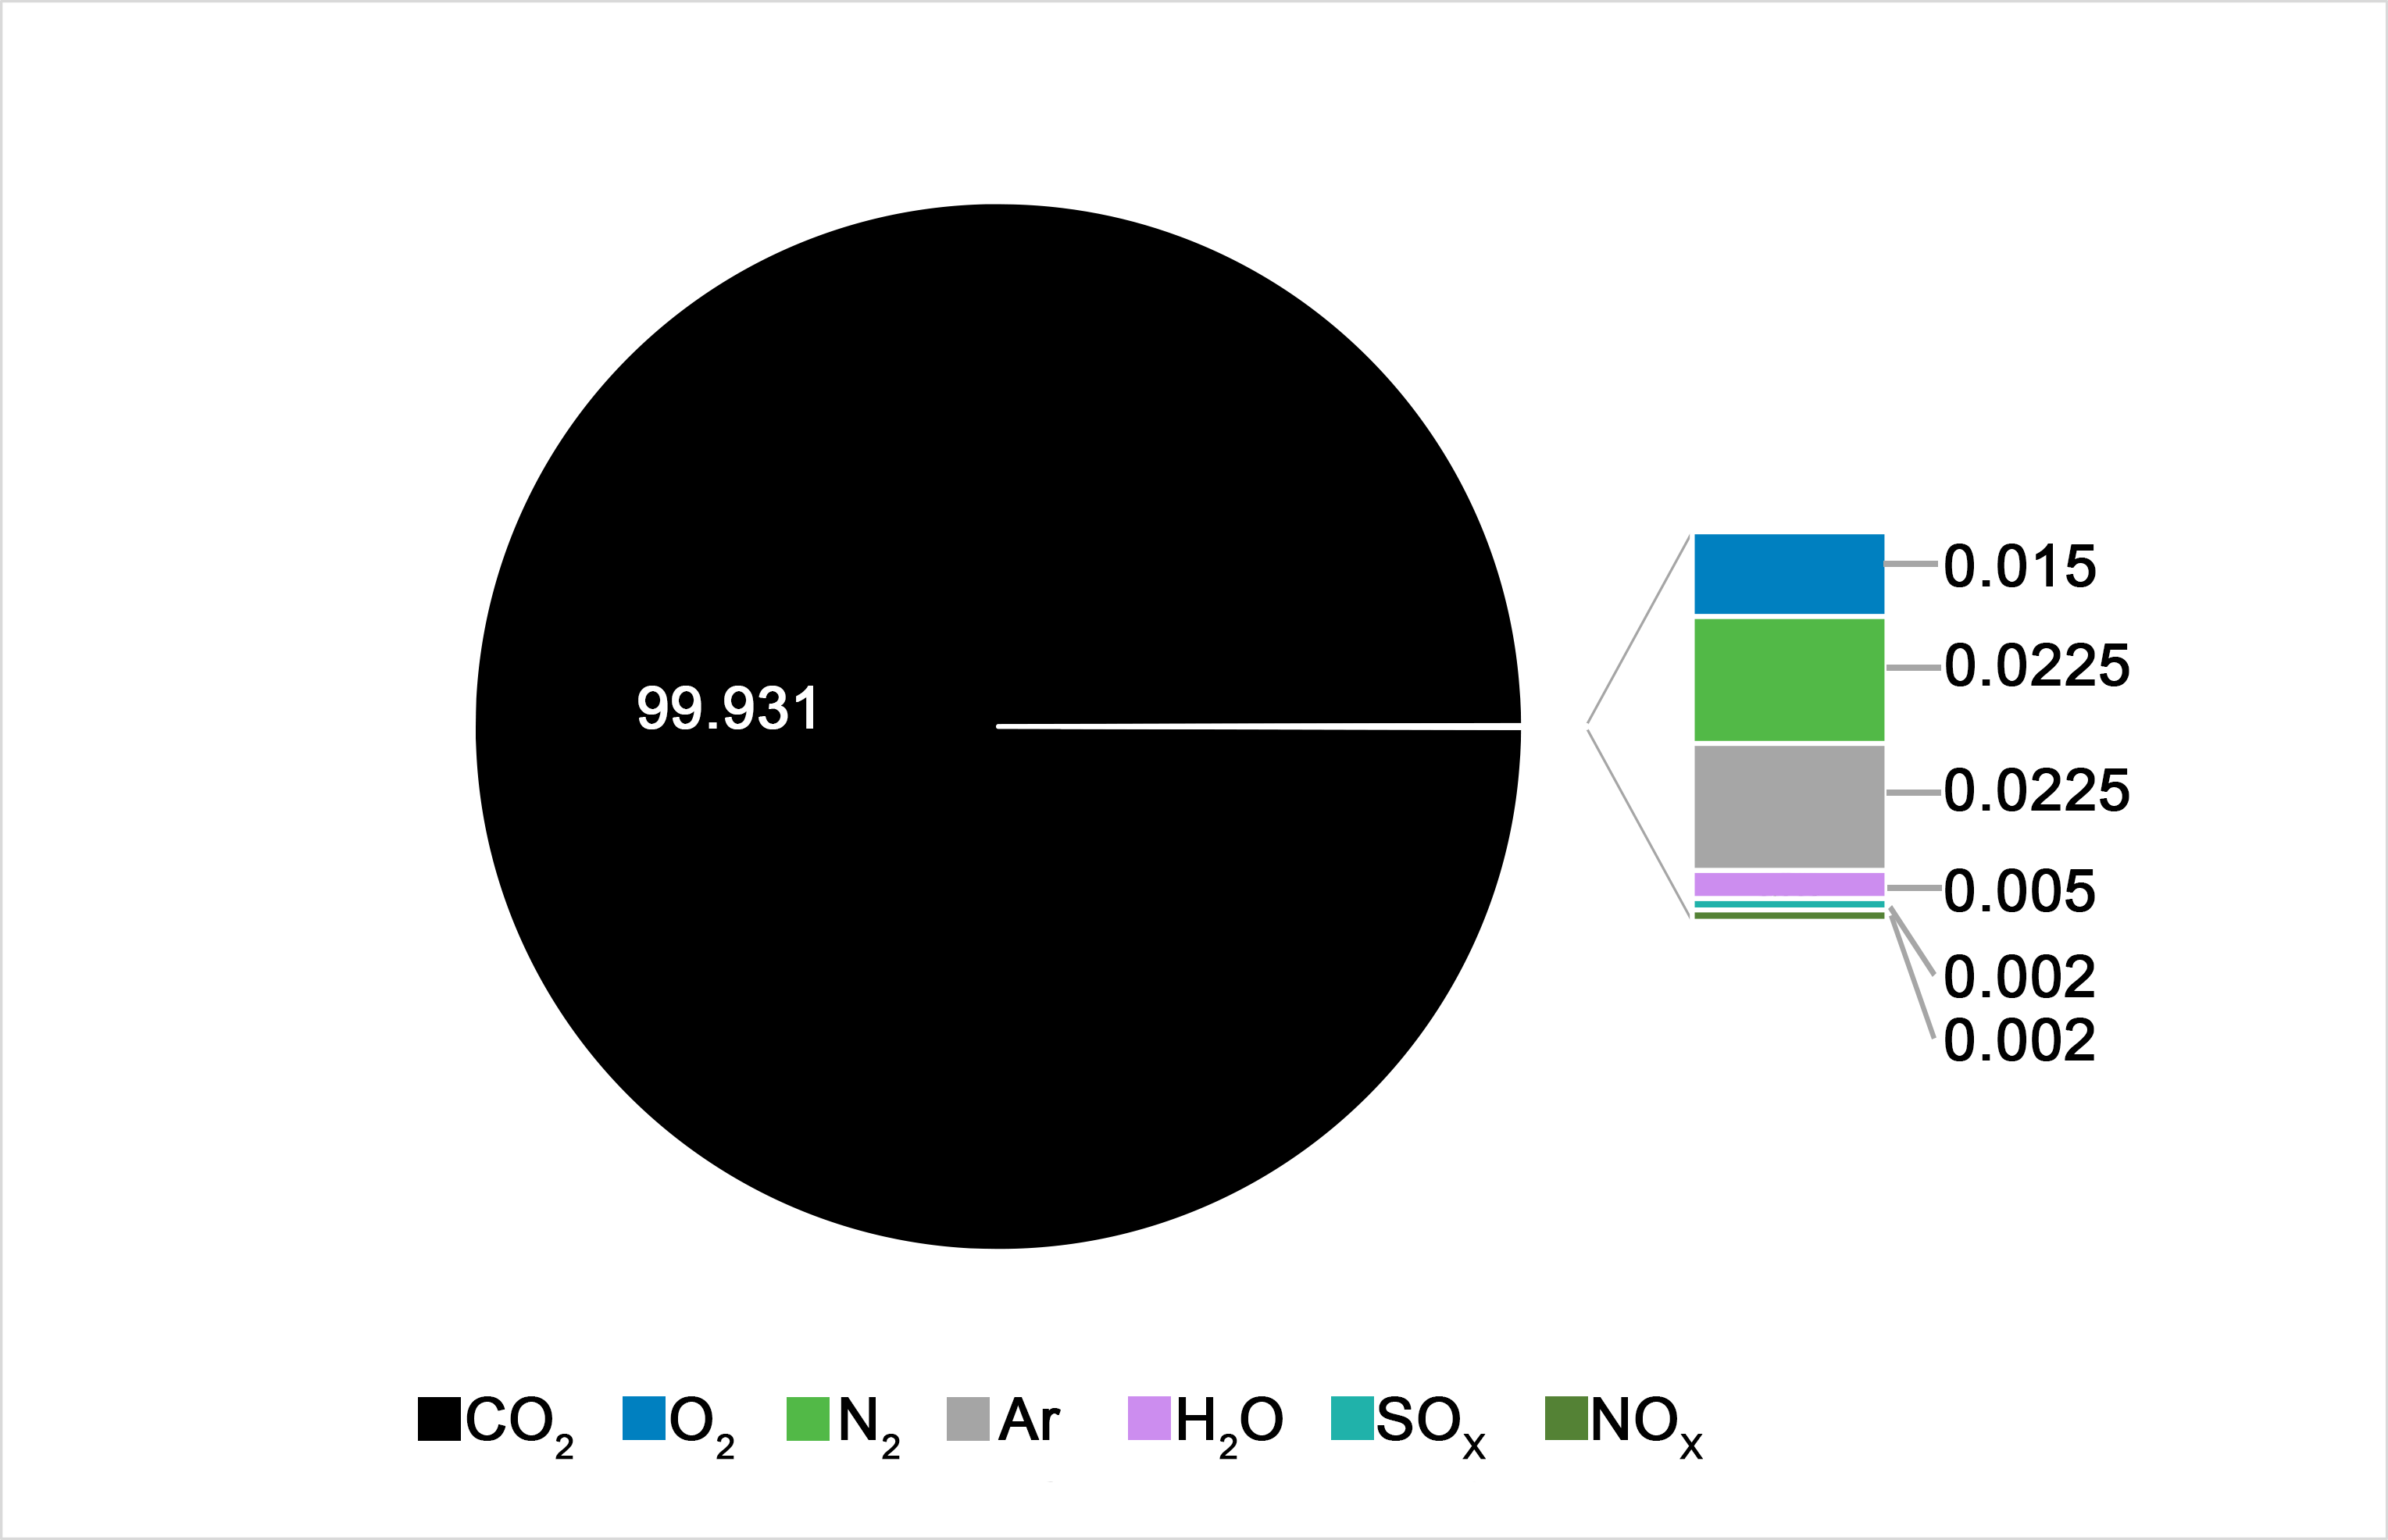
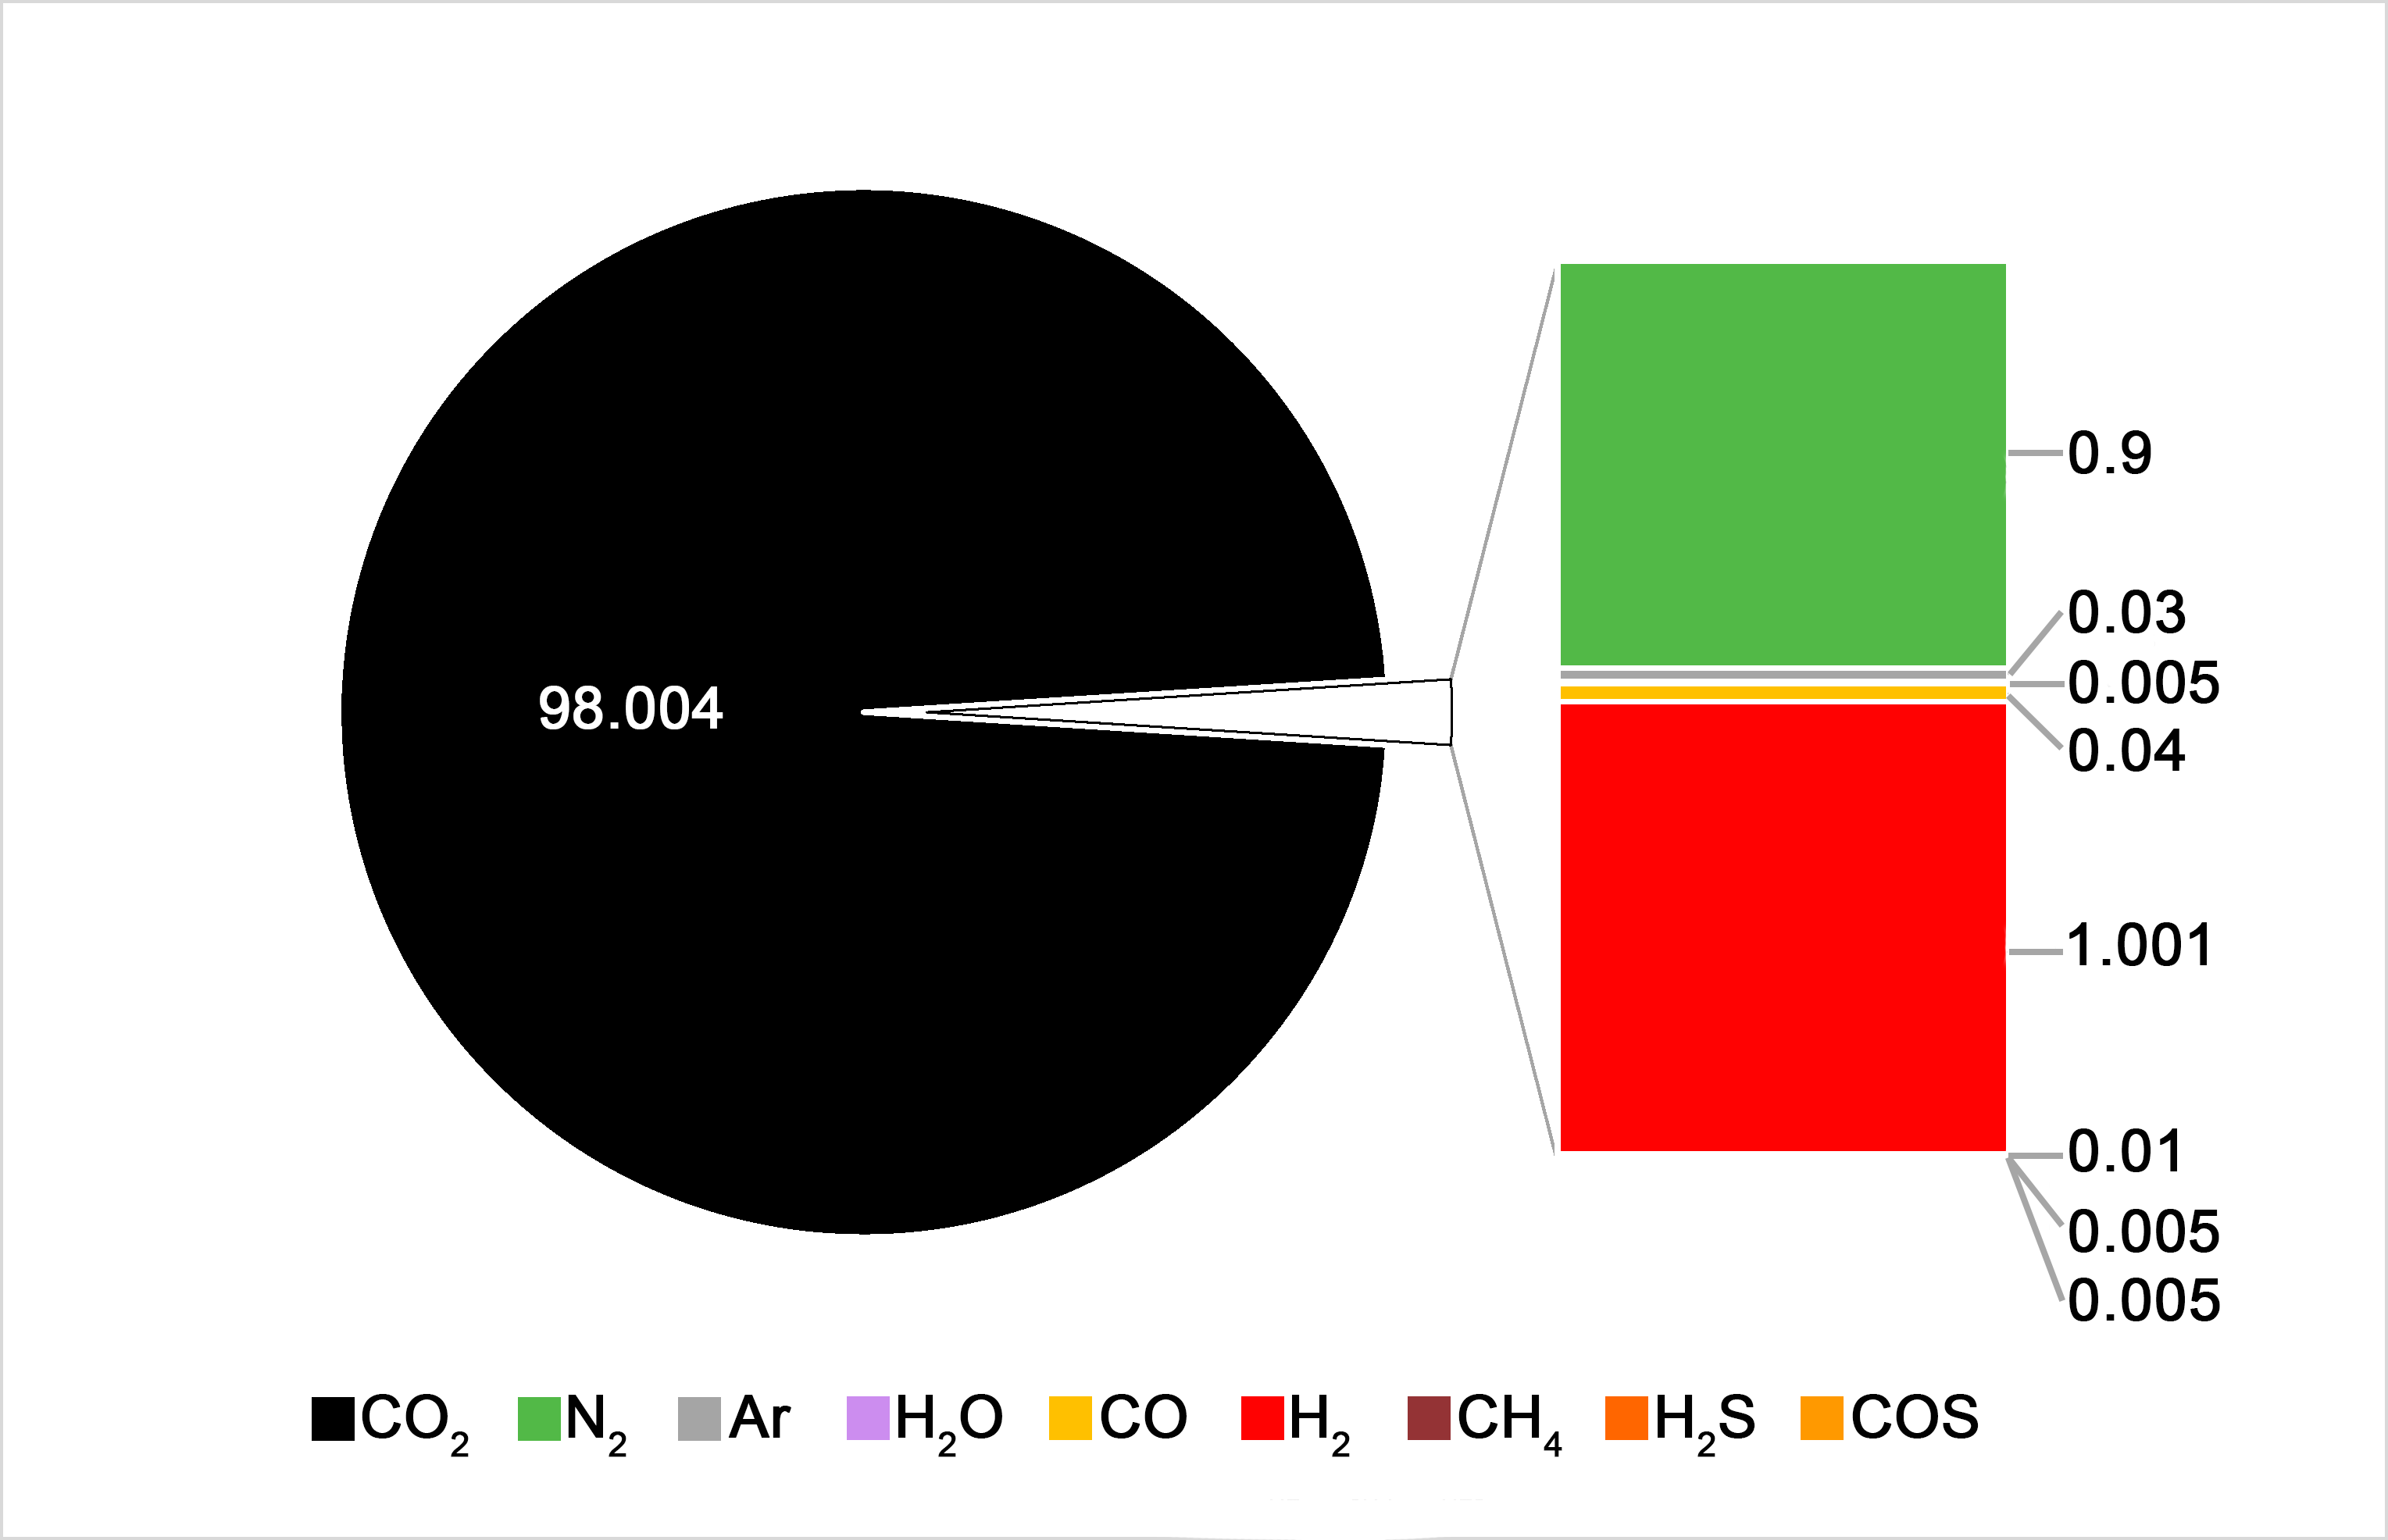
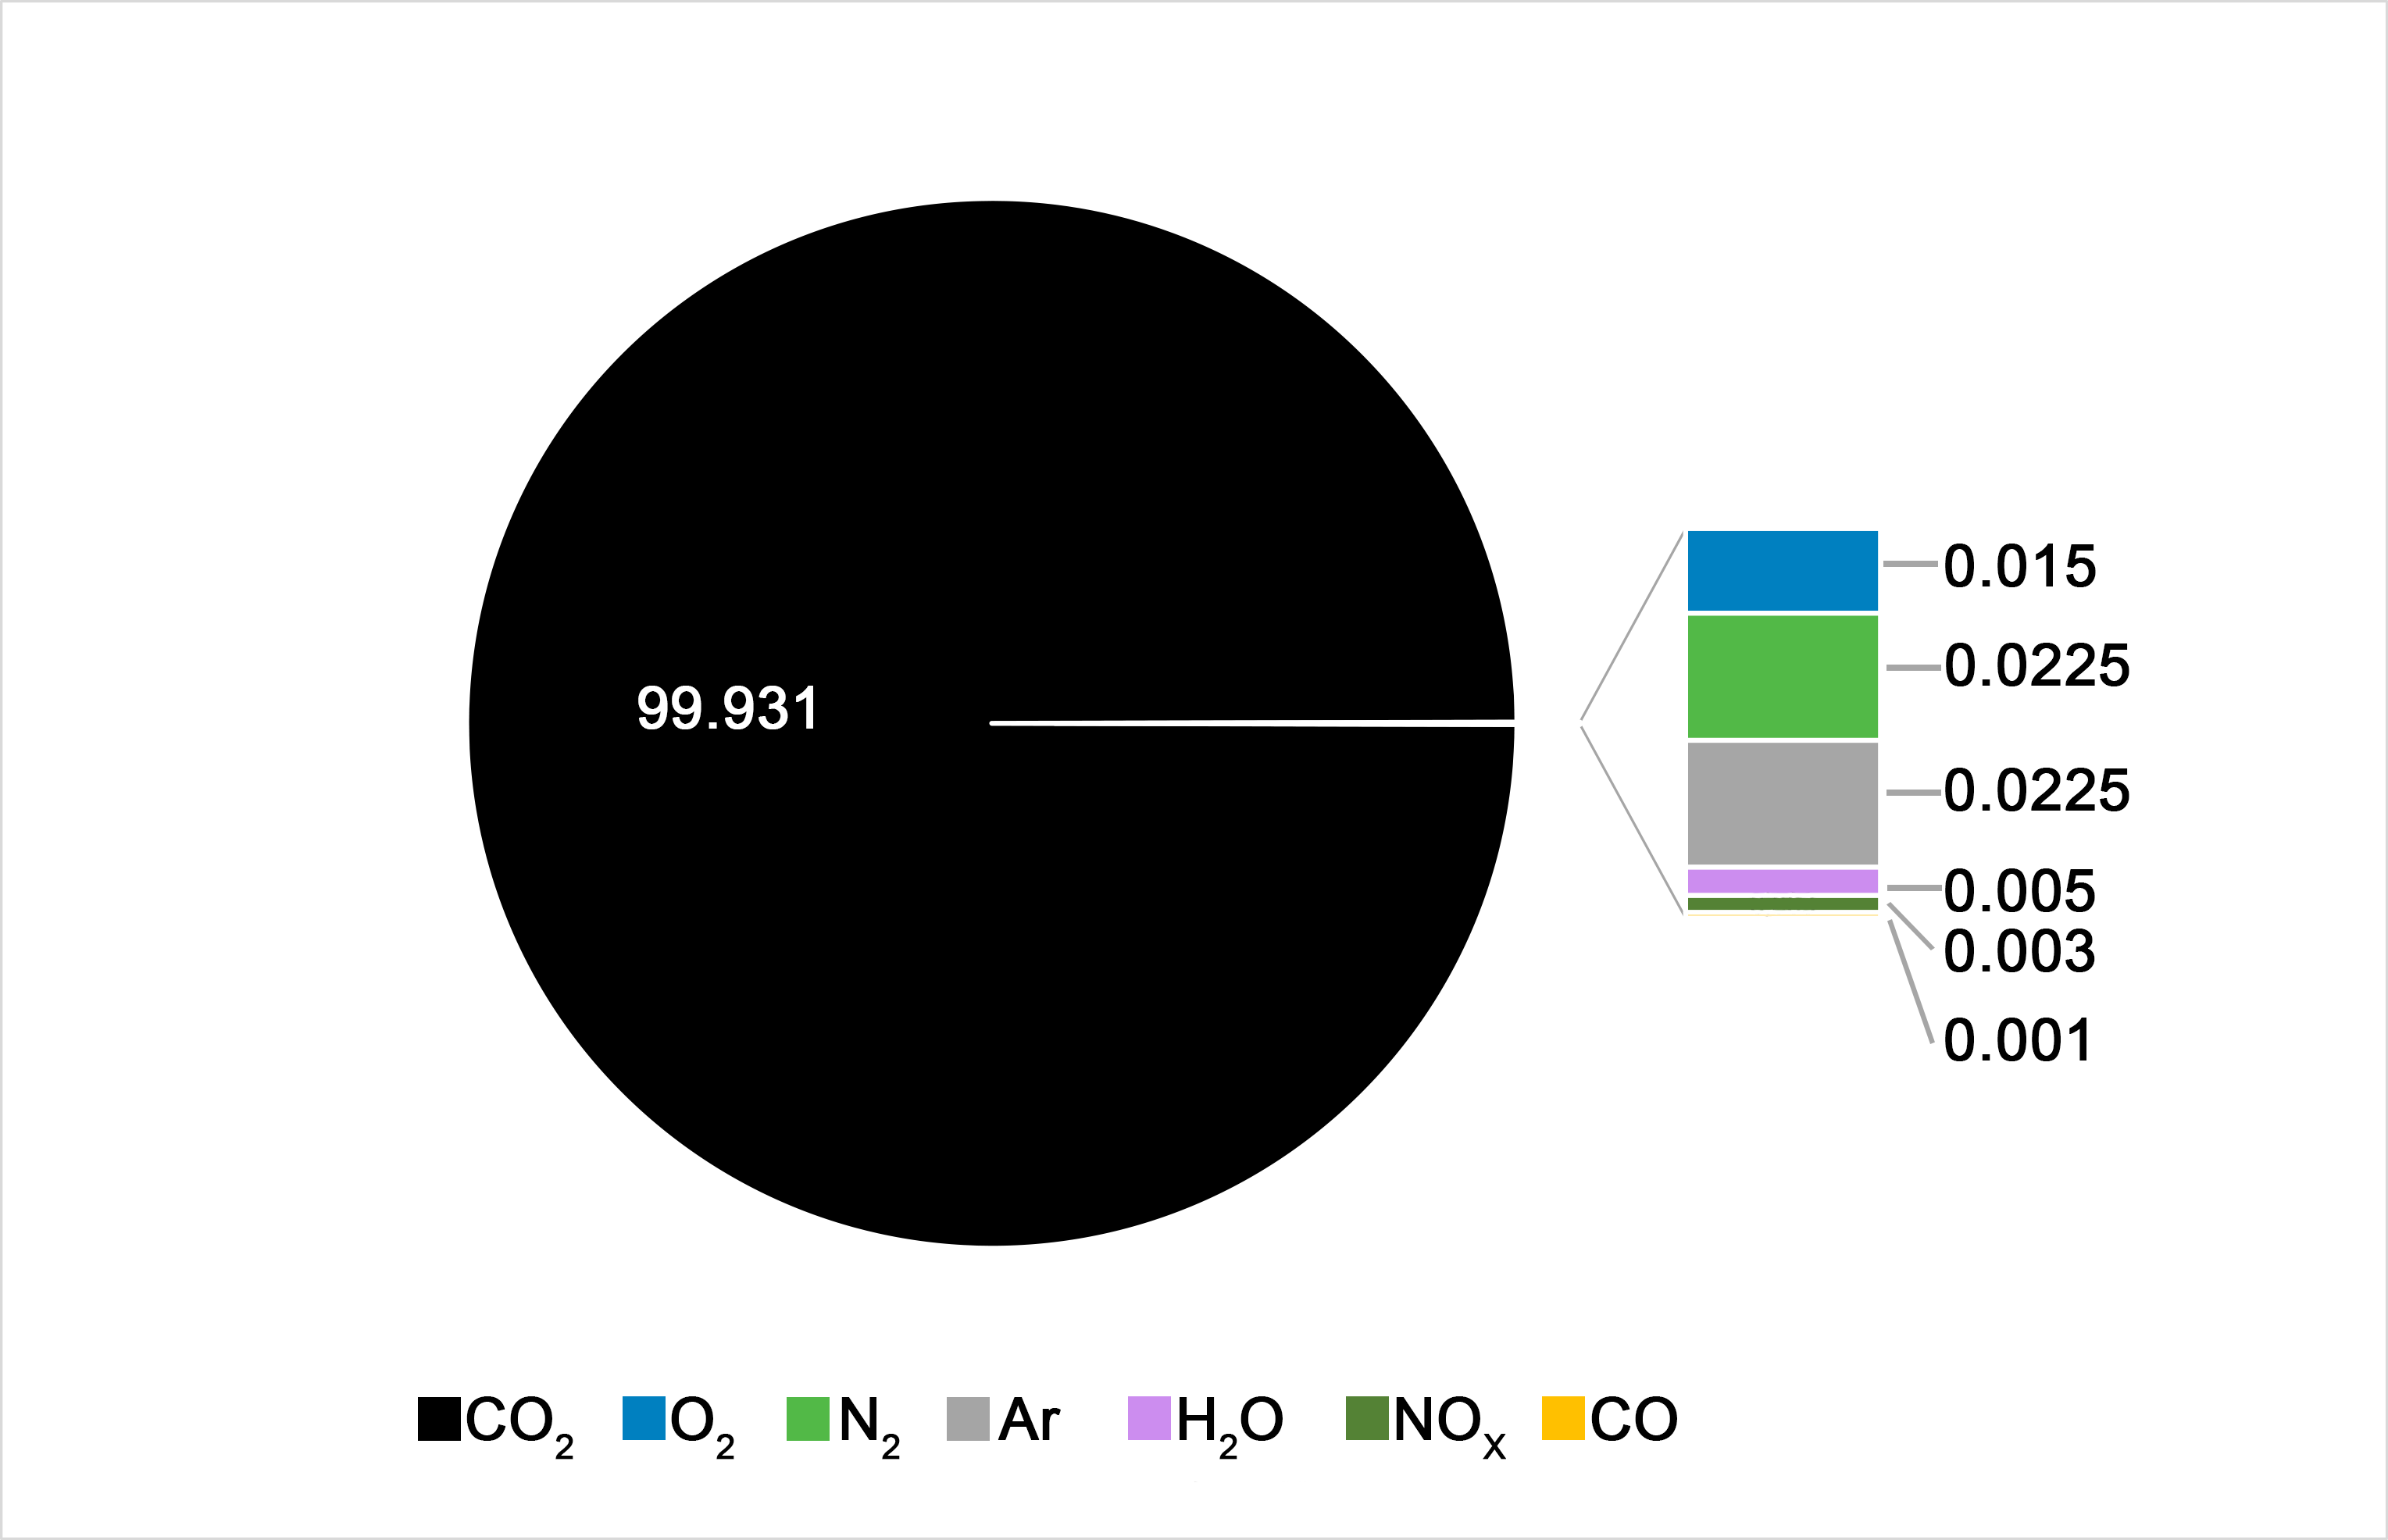
+++++ How pure do CO2 streams have to be for accessing CO2 transport and storage networks? +++++ See results from CLUSTER project in this webtool. +++++ What can be the impacts of temporally variable CO2 stream composition and mass flow rates on CO2 transport, injection and storage? ++++ Click on any element of the CCS chain for more information. +++++
CO2 Sources

CCS Cluster Scenario - CO2 Sources

Start
SVG files are not supportet by your browser!
Click on any plant for more information

CO2 Sources in CCS Cluster Scenario

CO2 Sources
RE29

Glossary

Energy Scenarios in CCS Cluster

  • Power plants’ annual operational loads were modelled according to
    real electricity production dataElectricity production data from European Network of Transmission System Operators for Electricity (ENTSO-E) @ www.entsoe.eu and European Energy Exchange (EEX) Transparency Platform @ www.eex-transparency.com
    in Germany in 2016 with a share of electricity production from renewable energy sources in the total electricity production of 29% (= reference scenario).
  • Refinery and iron and steel mill: constant operation, cement plants: shut-down period in winter, constant operation during the rest of the year on all scenarios.
  • Plants‘ operational loads result in plant-specific variable mass flow rates of captured
    CO2 streamsCO2 streams: A CO2 stream is a stream of substances that results from CO2 capture processes and that consists overwhelmingly of CO2 – cf. Directive 2009/31/EC.
    that are fed into the collection pipeline network.
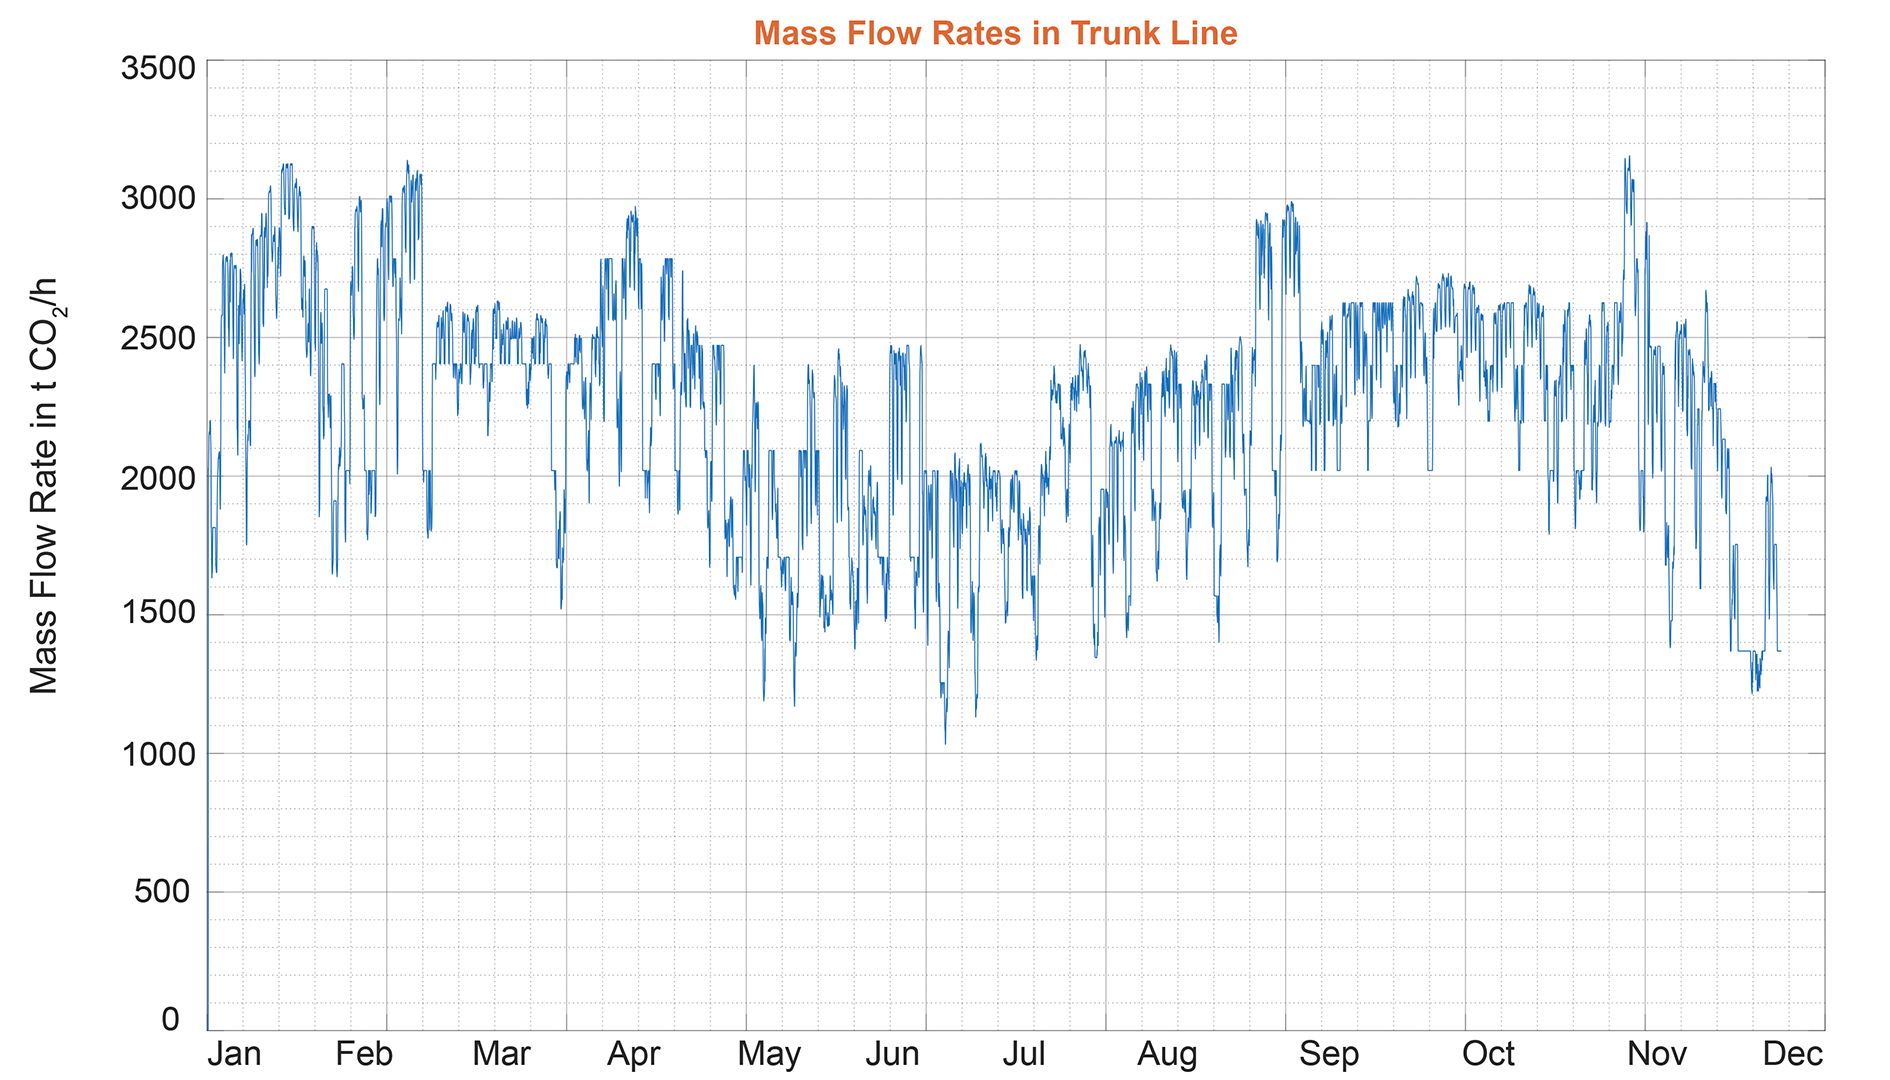
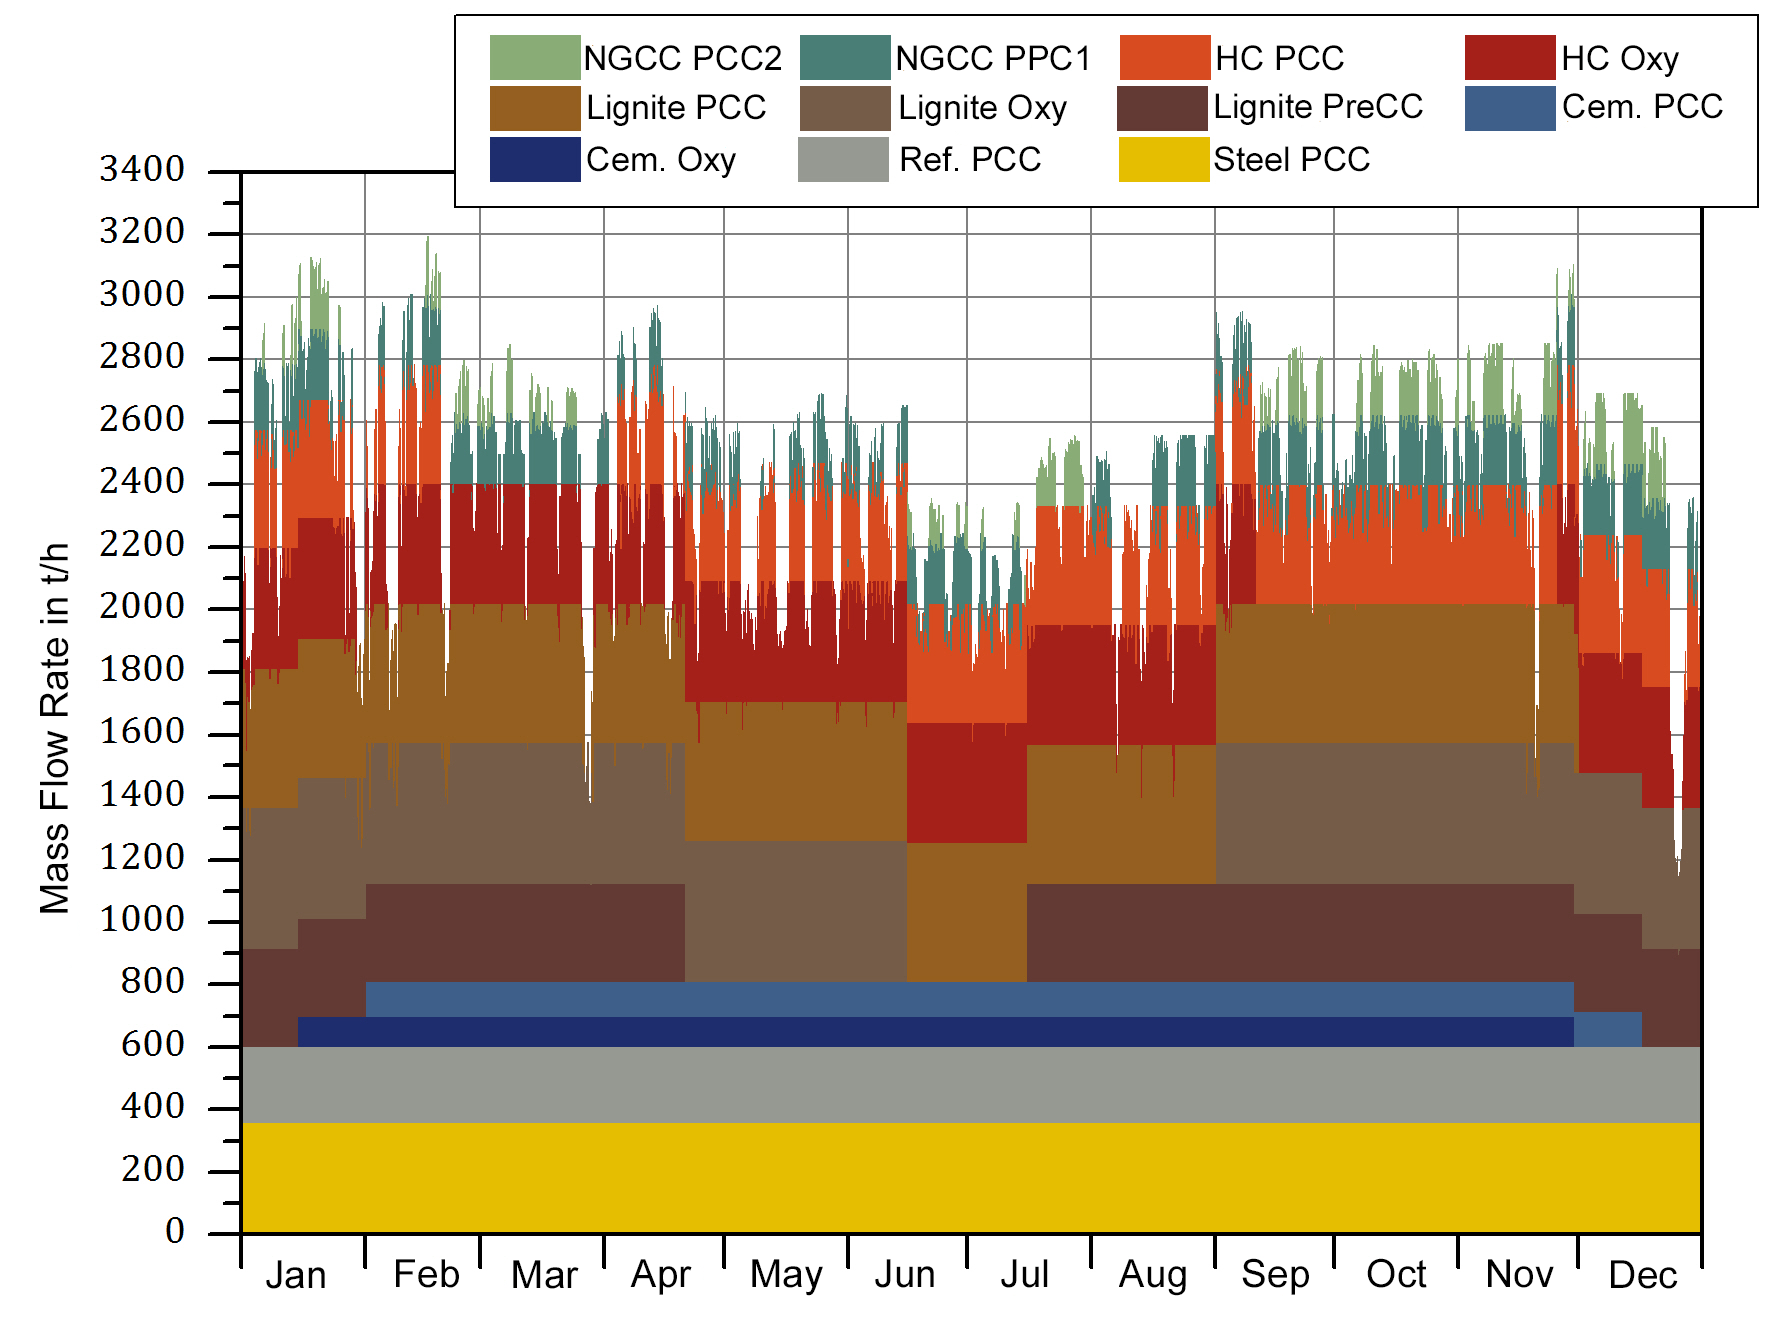
    mass flow ratesTotal mass flow rates of CO2 streams containing CO2 and impurities are termed pipeline mass flow rates
    in pipeline network vary throughout the year – see example in figure.
  • Other energy scenarios set up consider a fuel shift ( = scenario No Lignite) or a higher share of electricity produced from renewable energy sources (= scenarios RE45% and RE80%).

Energy Scenario RE29%

  • In this energy scenario, power plants‘ annual operational loads were defined based on real
    real electricity production dataElectricity production data from European Network of Transmission System Operators for Electricity (ENTSO-E) @ www.entsoe.eu and European Energy Exchange (EEX) Transparency Platform @ www.eex-transparency.com
    in Germany in 2016 (as hourly averages).
  • Resulting
    mass flow ratesTotal mass flow rates of CO2 streams containing CO2 and impurities are termed pipeline mass flow rates
    in pipeline network were highly variable throughout the year reflecting daily, weekly and seasonal trends – see example in figure.
Scenario Parameters & Results
Pipeline Mass Flow Rate
@ Trunk Line Entry
Ø
Min.
Max.
2197 t/h
1033 t/h
3195 t/h
Fuel Mix fuel-mix
Share of Renewable Energy (RE) Sources percentage

Energy Scenario No Lignite

  • In this energy scenario, lignite-fired power plants (from scenario RE29%) are substituted by two hard coal fired and one natural power plant (labelled as HC Oxy2, HC PCC2 and NGCC PCC3).
  • In scenario No Lignite,
    mass flow ratesTotal mass flow rates of CO2 streams containing CO2 and impurities are termed pipeline mass flow rates
    in the pipeline network were highly variable throughout the year. The average total mass flow rate in the trunk line was significantly lower than in scenario RE29%.
Scenario Parameters & Results
Pipeline Mass Flow Rate
@ Trunk Line Entry
Ø
Min.
Max.
1981 t/h
810 t/h
2876 t/h
Fuel Mix fuel-mix
Share of Renewable Energy (RE) Sources percentage

Energy Scenario RE45%

  • In this energy scenario, the assumed energy demand is the same as in scenario RE29%. Operational loads of power plants were adapted to an overall electricity production from renewable energy sources of 45% (assuming the same temporal RE electricity production characteristics as in scenario RE29%, but with capacity growth).
  • In scenario RE45%,
    mass flow ratesTotal mass flow rates of CO2 streams containing CO2 and impurities are termed pipeline mass flow rates
    in the pipeline network are even more variable throughout the year than in scenario RE29% - see example in figure.
Scenario Parameters & Results
Pipeline Mass Flow Rate
@ Trunk Line Entry
Ø
Min.
Max.
2023 t/h
604 t/h
3186 t/h
Fuel Mix fuel-mix
Share of Renewable Energy (RE) Sources percentage

Energy Scenario RE80%

  • In this energy scenario, the assumed energy demand is the same as in scenario RE29%. Operational loads of power plants were adapted to an overall electricity production from renewable energy sources of 80% (assuming the same temporal RE electricity production characteristics as in scenario RE29%, but with capacity growth).
  • In scenario RE80%,
    mass flow ratesTotal mass flow rates of CO2 streams containing CO2 and impurities are termed pipeline mass flow rates
    in the pipeline network are even more variable throughout the year than in scenario RE29% - see example in figure.
Scenario Parameters & Results
Pipeline Mass Flow Rate
@ Trunk Line Entry
Ø
Min.
Max.
1347 t/h
604 t/h
3130 t/h
Fuel Mix fuel-mix
Share of Renewable Energy (RE) Sources percentage
CO2 Sources

Glossary

CO2 Avoidance Costs in CCS Cluster

  • Power plants: CO2 avoidance costs are calculated as the additional costs (per ton of CO2 avoided) of CO2 capture implementation. Power plants’ avoidance costs strongly depend on each plant’s modelled number of full load hours (
    FLHFull load hours: Fictive number of hours in full load operation per year that would result in the same amount of impure CO2 per year.
    ) – see also CO2 avoidance costs for each plant in the different energy scenarios.
  • Industrial plants: CO2 avoidance costs are defined as the additional costs for CO2 capture (per ton of CO2 captured) at each plant. Note that the operational behaviour of industrial plants is the same in all energy scenarios – in consequence their CO2 avoidance costs don’t vary between the energy scenarios.

CO2 Avoidance Costs in Scenario RE29%

  • In all energy scenarios, power plants are deployed according to the merit order, i.e. plants with the lowest electricity production costs (
    LCoELCoE: natural gas fired plants > hard coal-fired plants > lignite-fired plants
    ) come online first to meet the electricity demand.
  • Due to their small number of full load hours (
    FLHFull load hours: Fictive number of hours in full load operation per year that would result in the same amount of impure CO2 per year.
    ), natural gas fired power plants have the highest CO2 avoidance costs.
  • The very high number of full load hours (
    FLHFull load hours: Fictive number of hours in full load operation per year that would result in the same amount of impure CO2 per year.
    ) of the industrial plants reduces their CO2 avoidance costs relative to the power plants having smaller numbers of full load hours.

CO2 Avoidance Costs in Scenario NoLignite

  • In this energy scenario, all three lignite fired power plants (in scenario RE29%) are substituted by two hard coal fired and one natural gas fired power plant (labelled as HC Oxy2, HC PCC2 and NGCC PCC3) .
  • As in the other energy scenarios, power plants with the lowest electricity production costs (
    LCoELCoE: natural gas fired plants > hard coal-fired plants > lignite-fired plants
    ) come online first to meet the electricity demand.
  • The very small number of full load hours (
    FLHFull load hours: Fictive number of hours in full load operation per year that would result in the same amount of impure CO2 per year.
    ) of natural gas fired power plants leads to their very high CO2 avoidance costs (in particular of plant NGCC PCC3).
  • The very high number of full load hours (
    FLHFull load hours: Fictive number of hours in full load operation per year that would result in the same amount of impure CO2 per year.
    ) of the industrial plants reduces their CO2 avoidance costs relative to the power plants having smaller numbers of full load hours.

CO2 Avoidance Costs in Scenario RE45%

  • In all energy scenarios, power plants with the lowest electricity production costs (
    LCoELCoE: natural gas fired plants > hard coal-fired plants > lignite-fired plants
    ) come online first to meet the electricity demand.
  • Due to their small number of full load hours (
    FLHFull load hours: Fictive number of hours in full load operation per year that would result in the same amount of impure CO2 per year.
    ), natural gas fired power plants have the highest CO2 avoidance costs.
  • The very high number of full load hours (
    FLHFull load hours: Fictive number of hours in full load operation per year that would result in the same amount of impure CO2 per year.
    ) of the industrial plants reduces their CO2 avoidance costs relative to the power plants having smaller numbers of full load hours.

CO2 Avoidance Costs in Scenario RE80%

  • In all energy scenarios, power plants with the lowest electricity production costs (
    LCoELCoE: natural gas fired plants > hard coal-fired plants > lignite-fired plants
    ) come online first to meet the electricity demand.
  • Due to their small number of full load hours (
    FLHFull load hours: Fictive number of hours in full load operation per year that would result in the same amount of impure CO2 per year.
    ), natural gas fired power plants have the highest CO2 avoidance costs.
  • The very high number of full load hours (
    FLHFull load hours: Fictive number of hours in full load operation per year that would result in the same amount of impure CO2 per year.
    ) of the industrial plants reduces their CO2 avoidance costs relative to the power plants having smaller numbers of full load hours.
CO2 Sources
Pipeline Transport

Click for details on Ship Transport


CCS Cluster Scenario - Pipeline Transport

Start

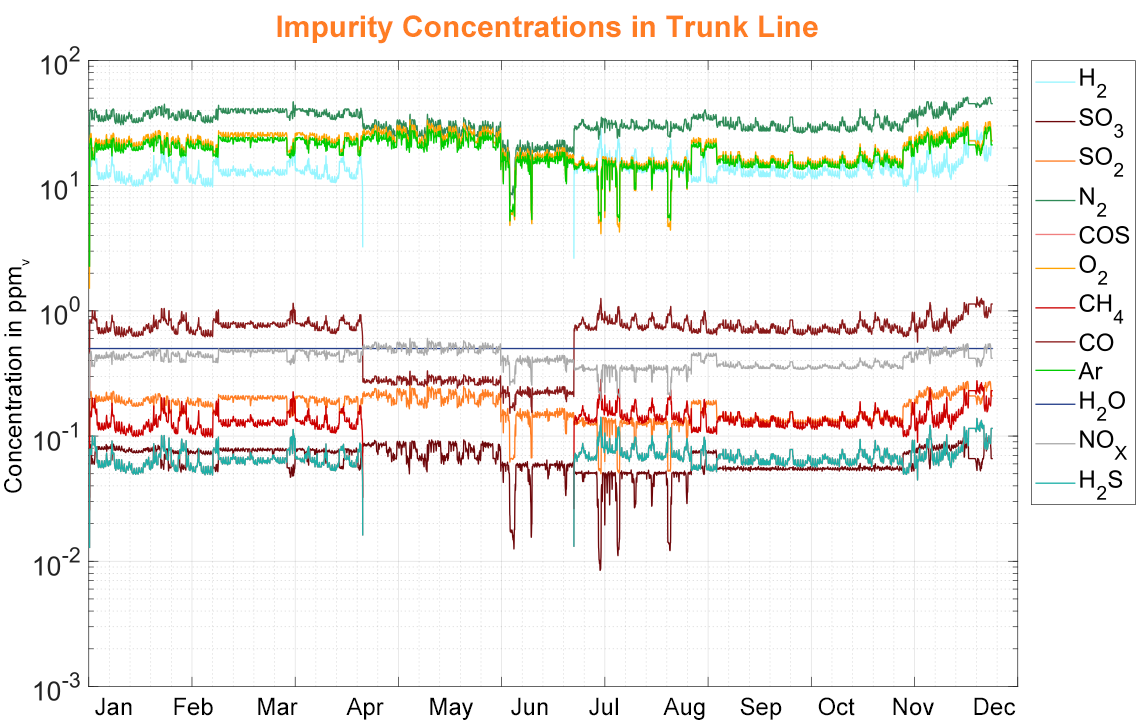
Variable CO2 Stream Compositions & Mass Flow Rates in Pipeline Network

BeispielBild1
1/3
Pipeline Transport
Beispielbild0

Overview: Acid Formation, Reactive Wetting and Material Selection

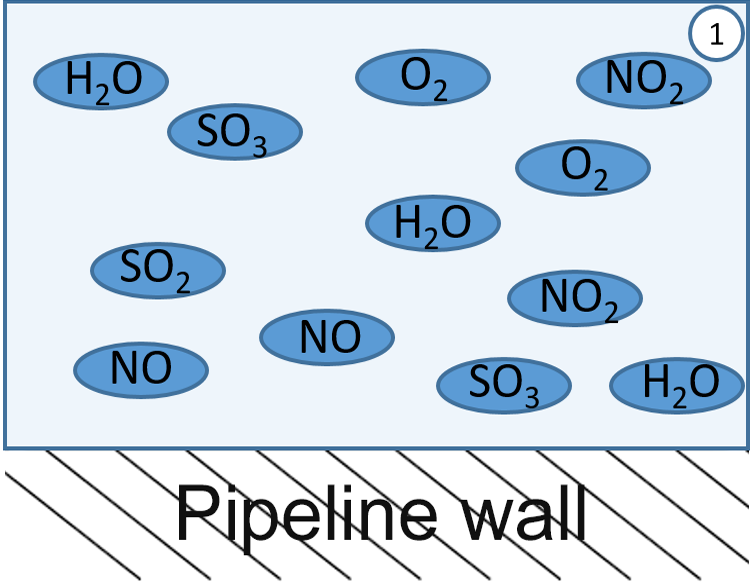
When different impurities are present in the CO2 stream (1), they may react with each other forming new impurities such as nitric acid and sulfuric acid (2).
Depending on pressure (p = 7-15 MPa) and temperature (here T = 283 and 278 K in onshore and offshore parts of trunk line, respectively), these acids can condense and form highly acidic droplets on the pipeline wall (3).
If the droplets spread and stay on the pipeline wall, reactive wetting may occur involving corrosion of the pipeline wall (4). For further details klick the boxes below.

Zeitachse
Pipeline Transport

Costs of Pipeline Transport

Pipeline Transport
Ship Transport

CCS Cluster Scenario - Ship Transport

Start
Case 1: 1 Mt/year (pure CO2)
Beispielbild1
Case 2: 20 Mt/year (pure CO2 scenario RE29%)
Beispielbild1

Ship Transport - Logistics

Ship Transport

CO2 Liquefaction for Ship Transport –
Energy Demand

Ship Transport

Costs of Ship-Based CO2 Transport

Ship Transport
Injection

CCS Cluster Scenario - Injection

Start
Beispielbild1 Beispielbild2

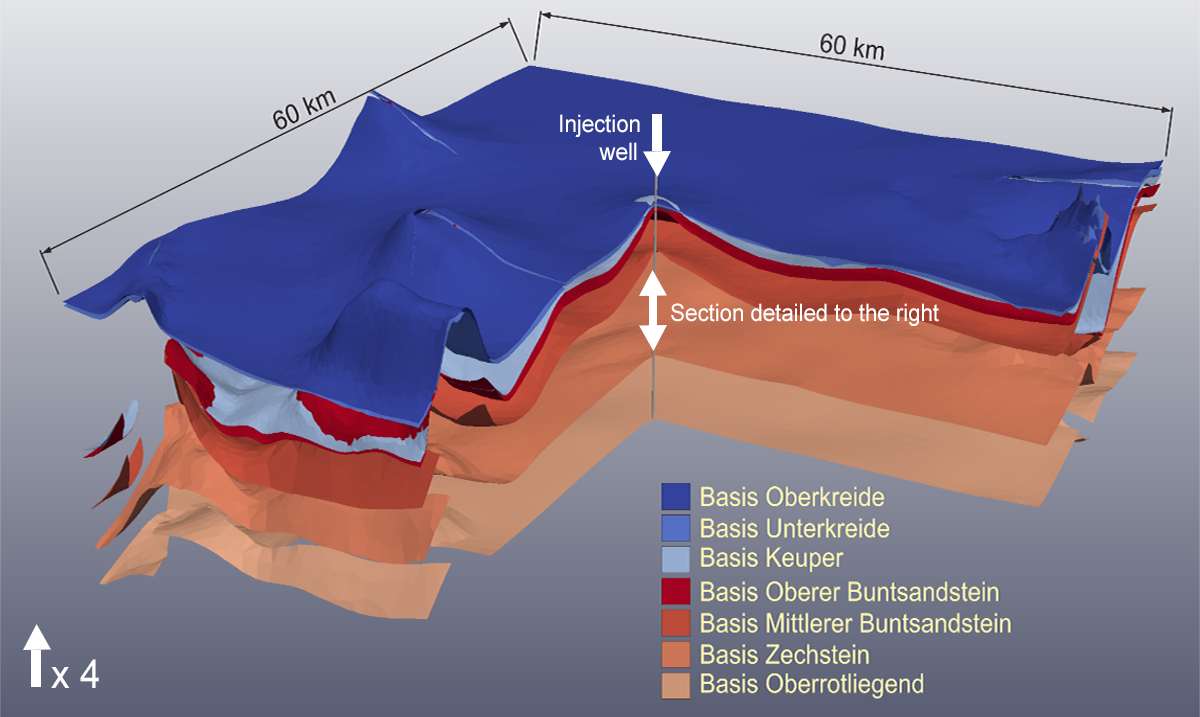
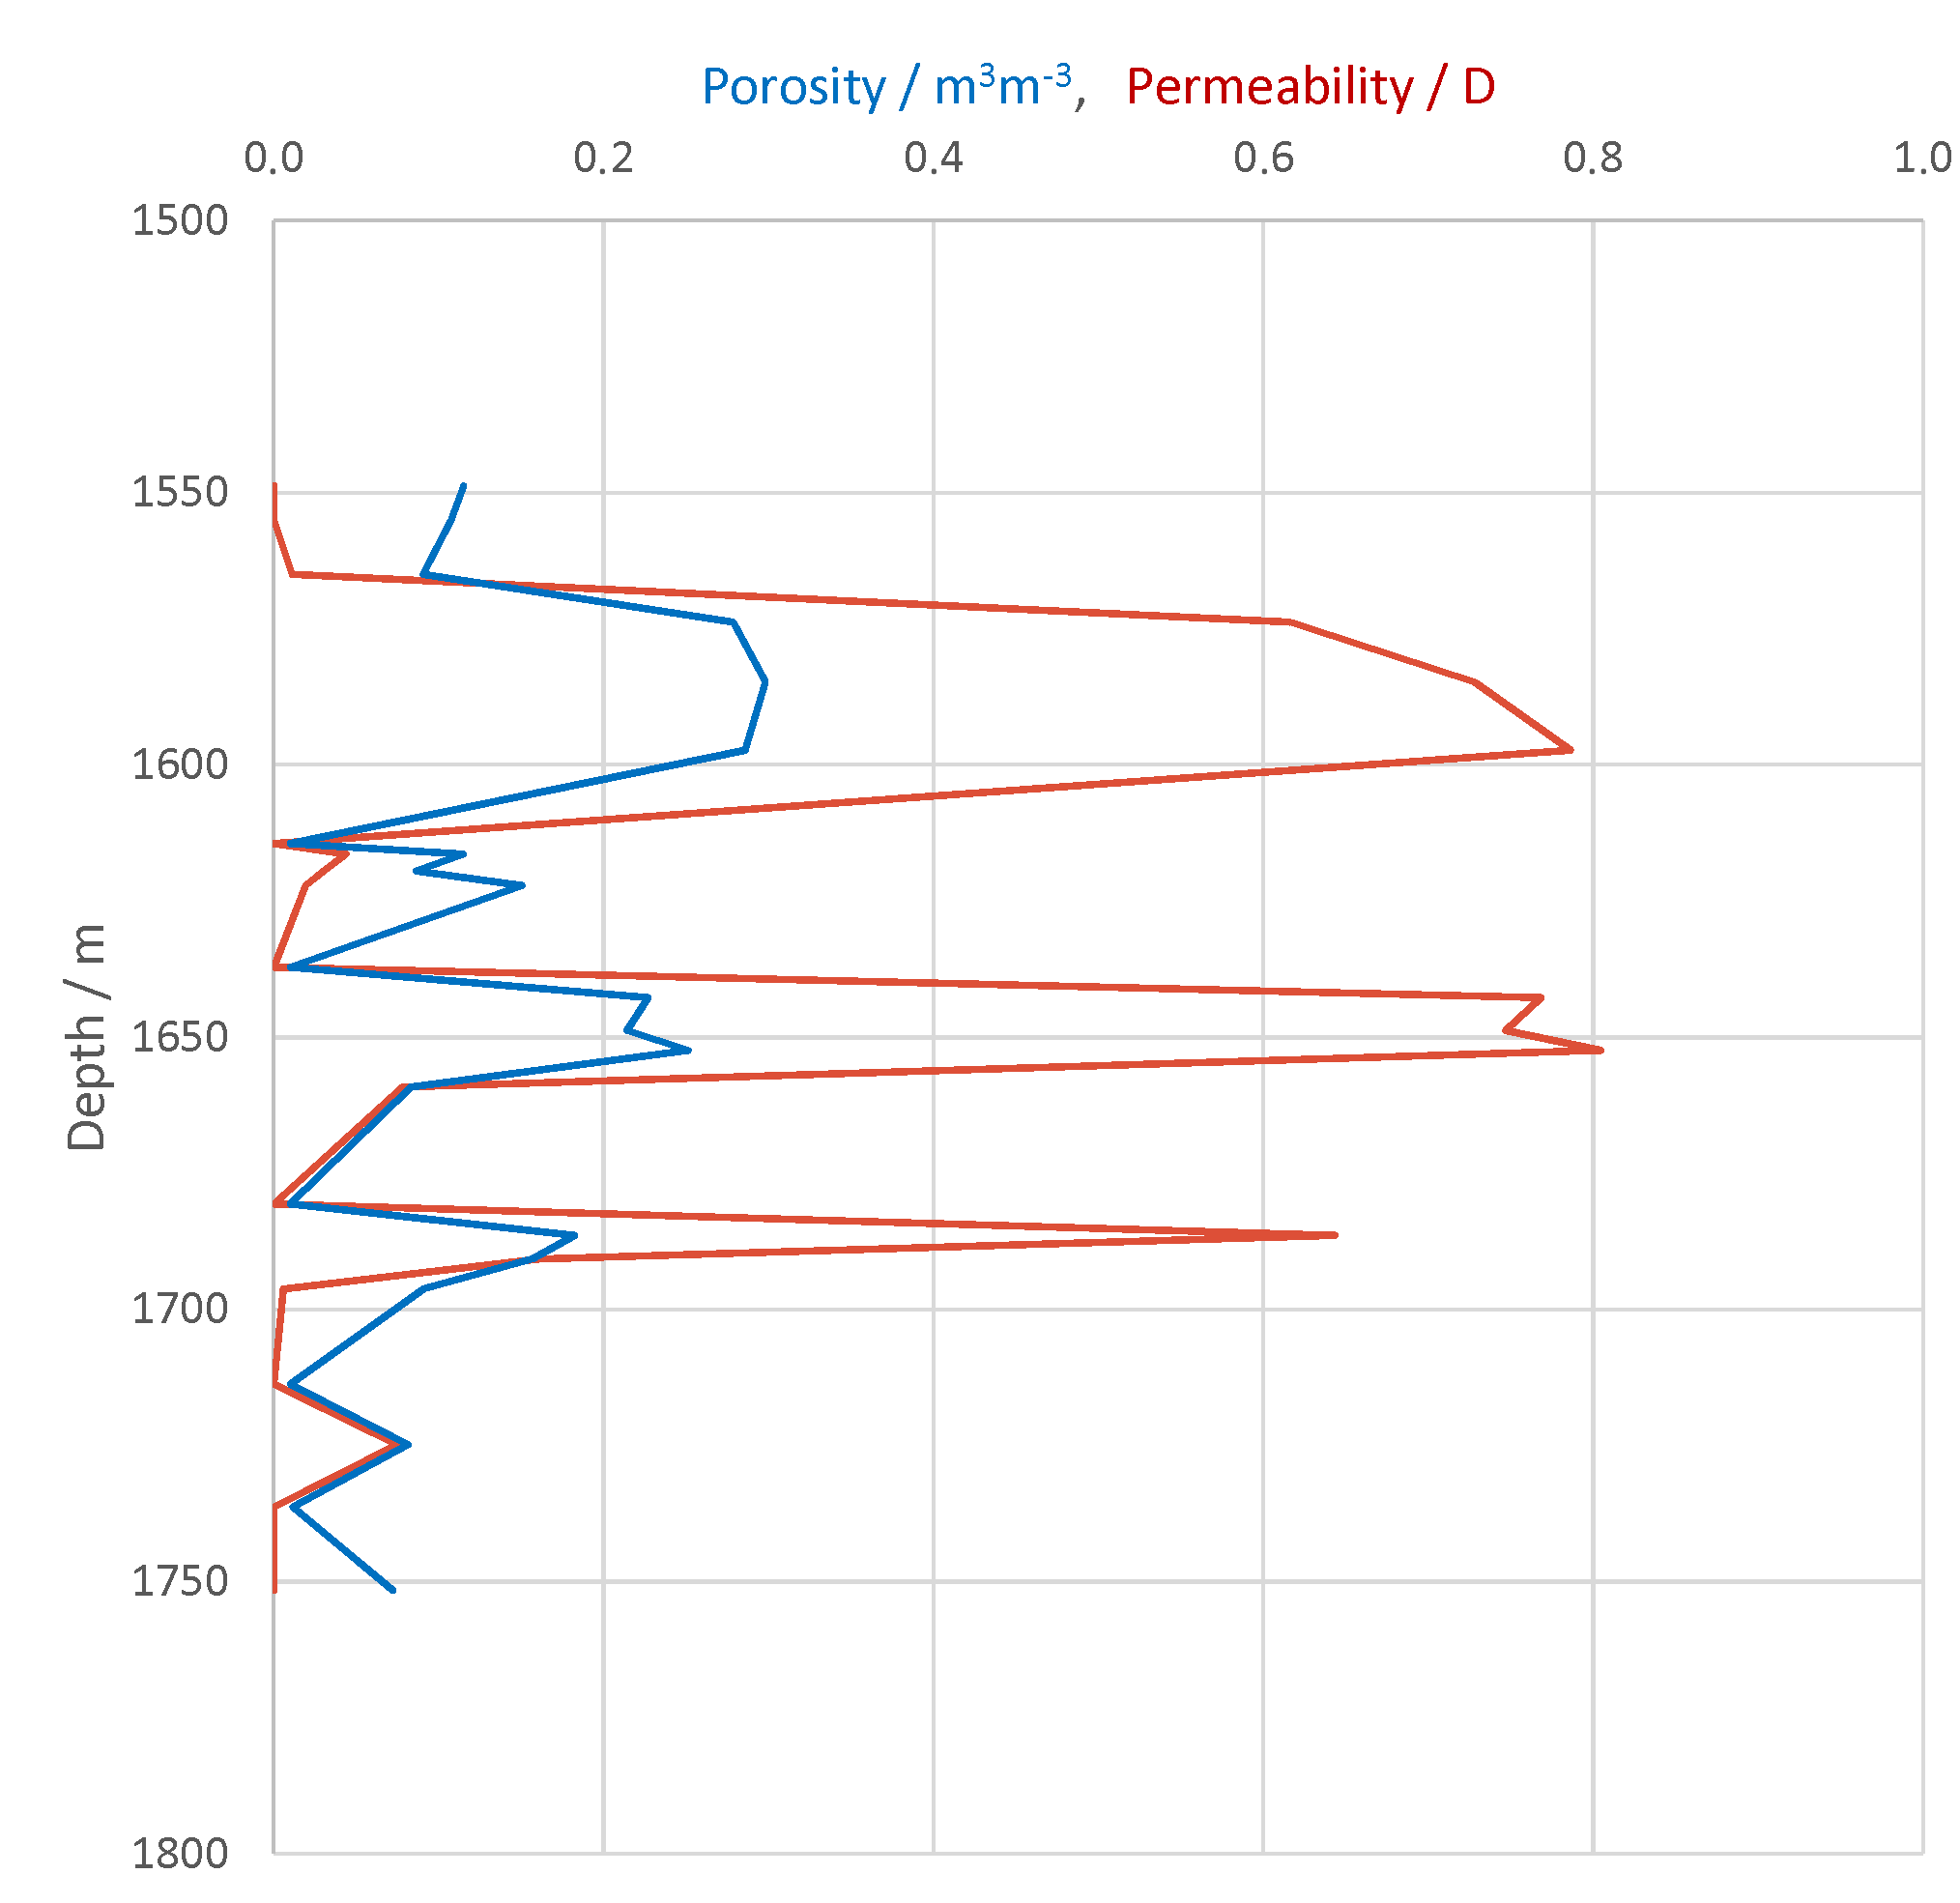
Generic Offshore Storage Site

Injection
alt

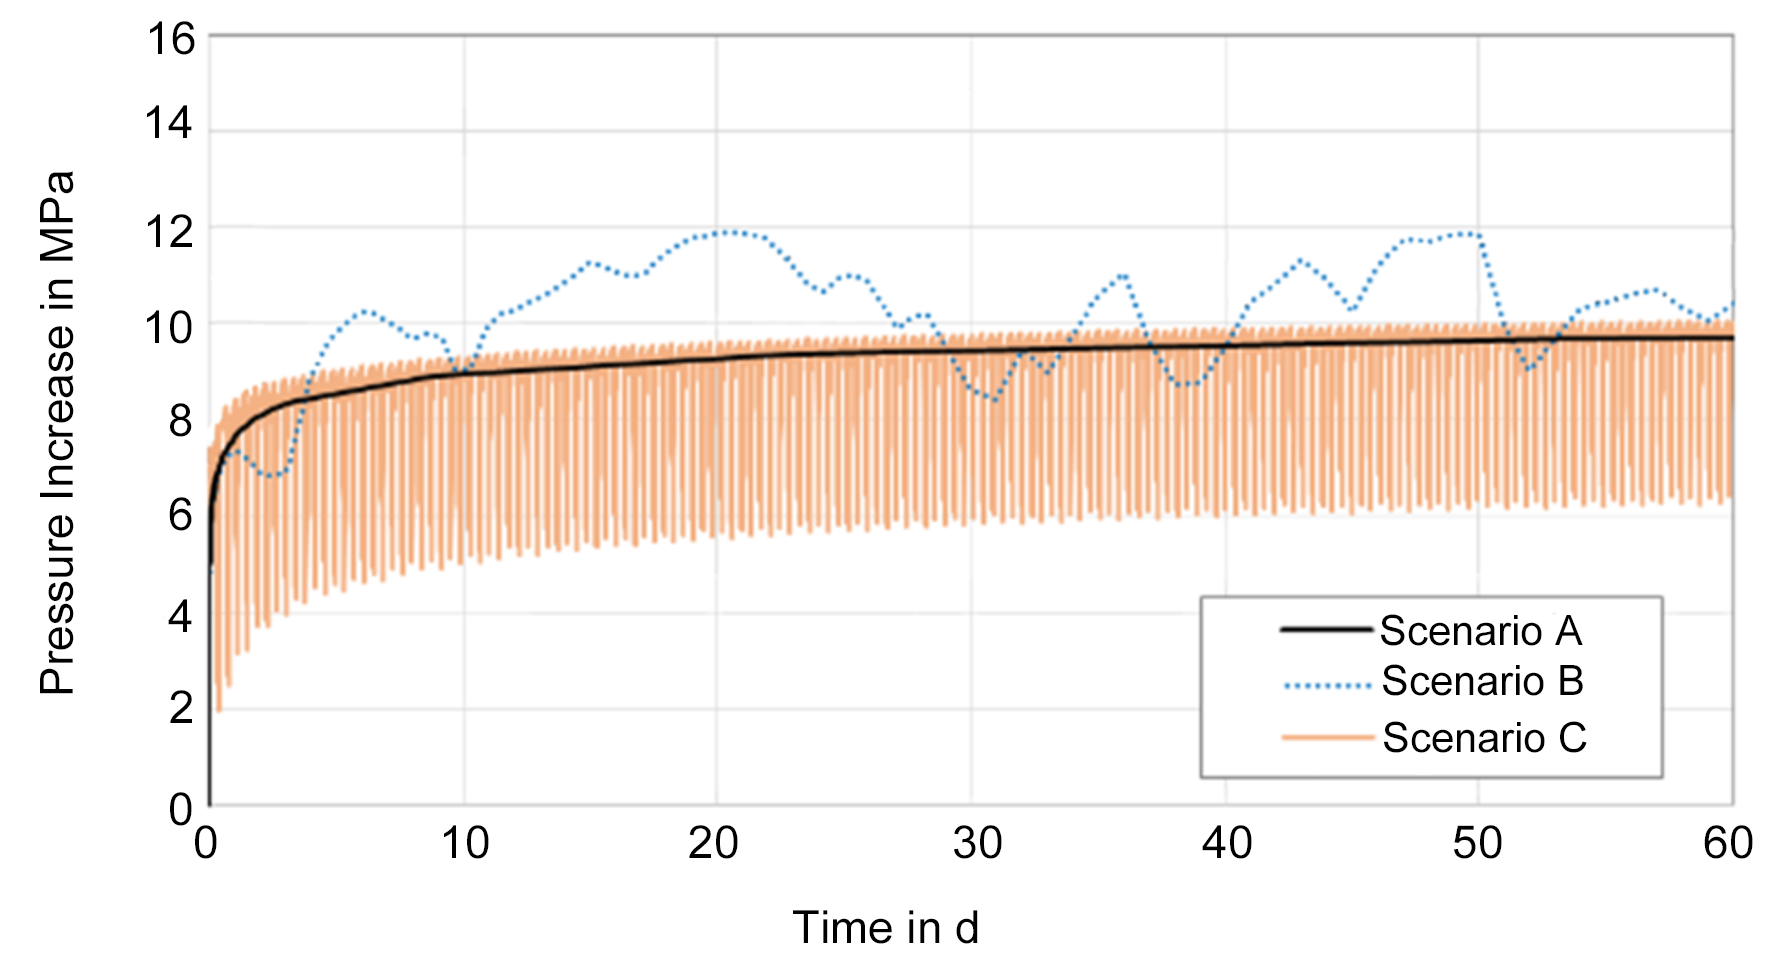
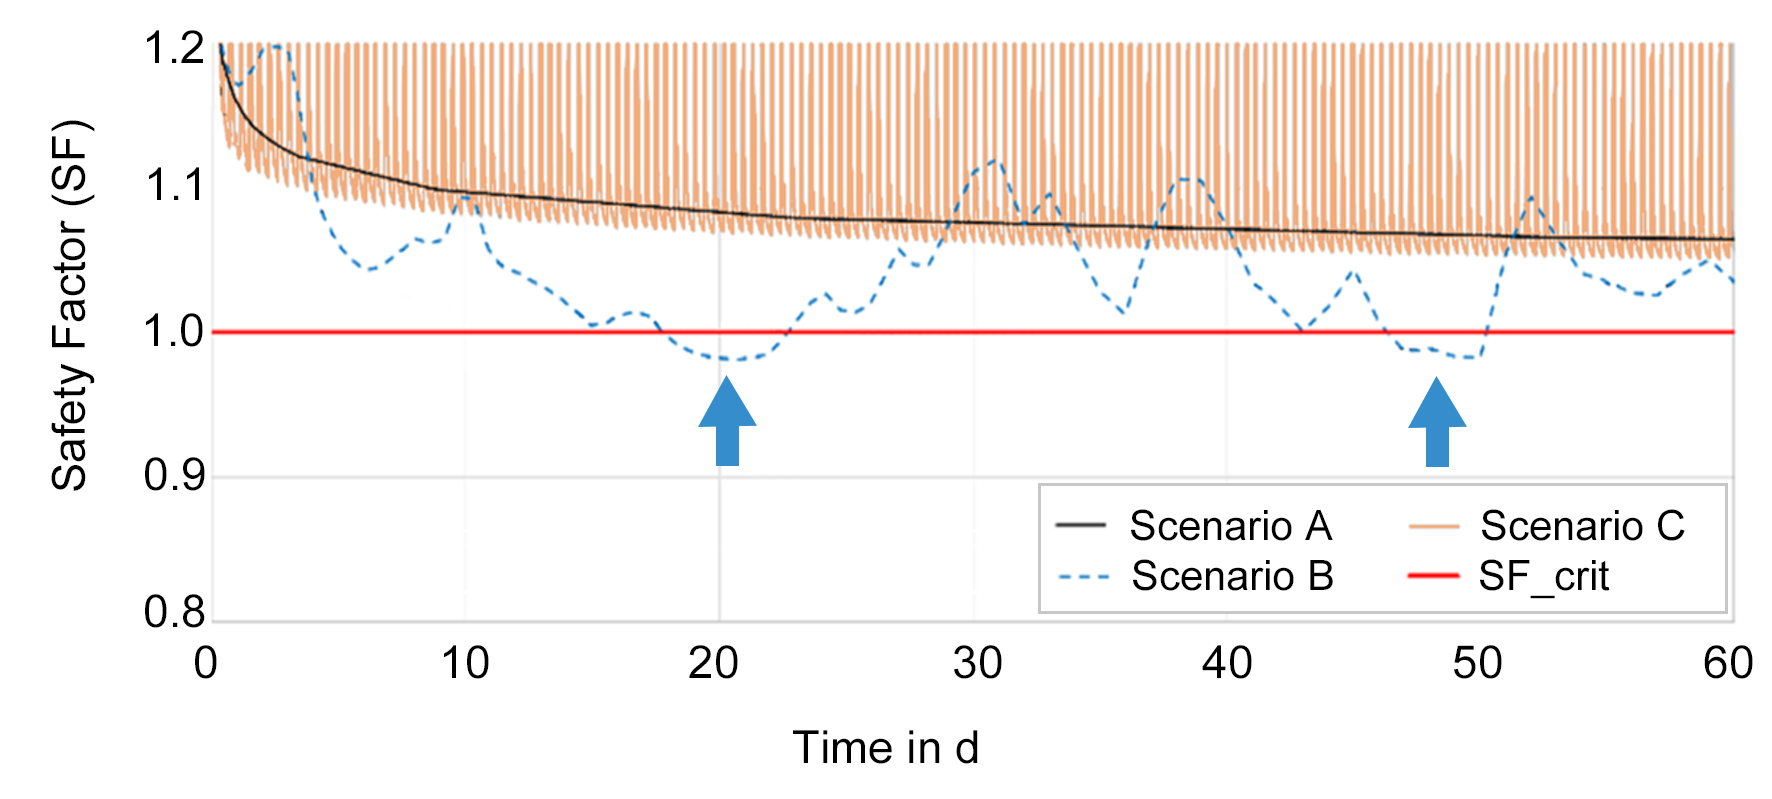
Injection Scenarios – Impact of Variable Injection Rates

Scenario A: Constant mass flow rate of 450 t/h (for injection of 1/5 of total annual amount);
Scenario B: Variable mass flow rate (fluctuations according to energy scenario RE29%)
Scenario C: Cyclically fluctuating mass flow rate (e.g. from ship transport supply)
Injection Details
Beispielbild1
Injection
Beispielbild1

Injection Costs

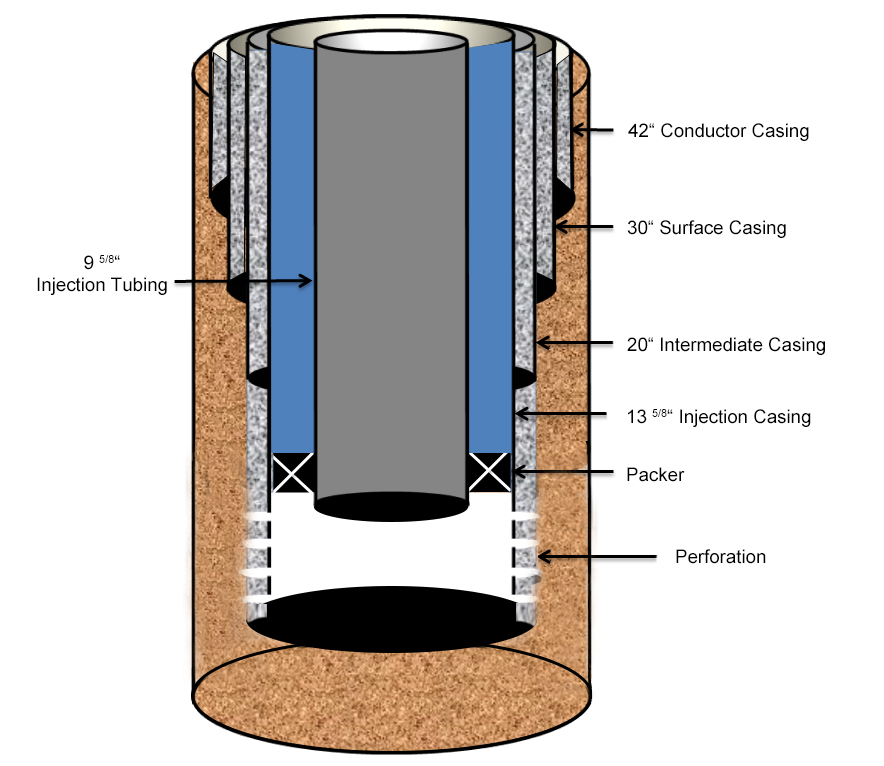
  • For our scenario, injection wells were designed according to standards by the American Petroleum Institute (API). For example, CO2-compatible steels L80-9Cr or L80-13Cr were considered for tubing and casing at packer and below.

  • Estimated capital expenditures for one vertical offshore injection well totalled about 30.4 Mio. € comprising drilling and well completion costs (50%), platform costs (32%) and material costs (18%). This resulted in specific invest costs of about 1 €/t CO2 in our scenario RE29%.

  • After ship transport (at T = 223 K), liquefied CO2 must be heated e.g. to 278 K prior to injection to avoid hydrate formation. This can be done on the ship or using a permanently installed platform. For an injection from the ship using a submerged turret system, specific capital costs of 0.5 €/t CO2 are estimated in our scenario RE29% with operating costs of about 0.2 €/t CO2.
Injection
Storage

CCS Cluster Scenario - Storage

Start
Beispielbild1

    Behaviour of CO2 and Impurities in Storage Reservoir

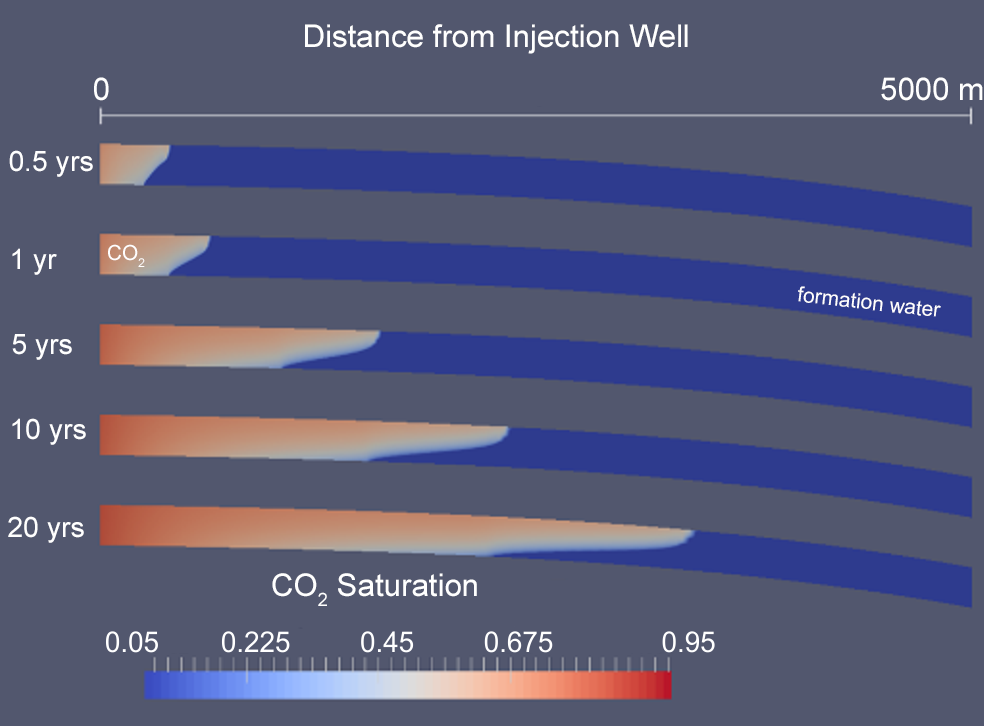
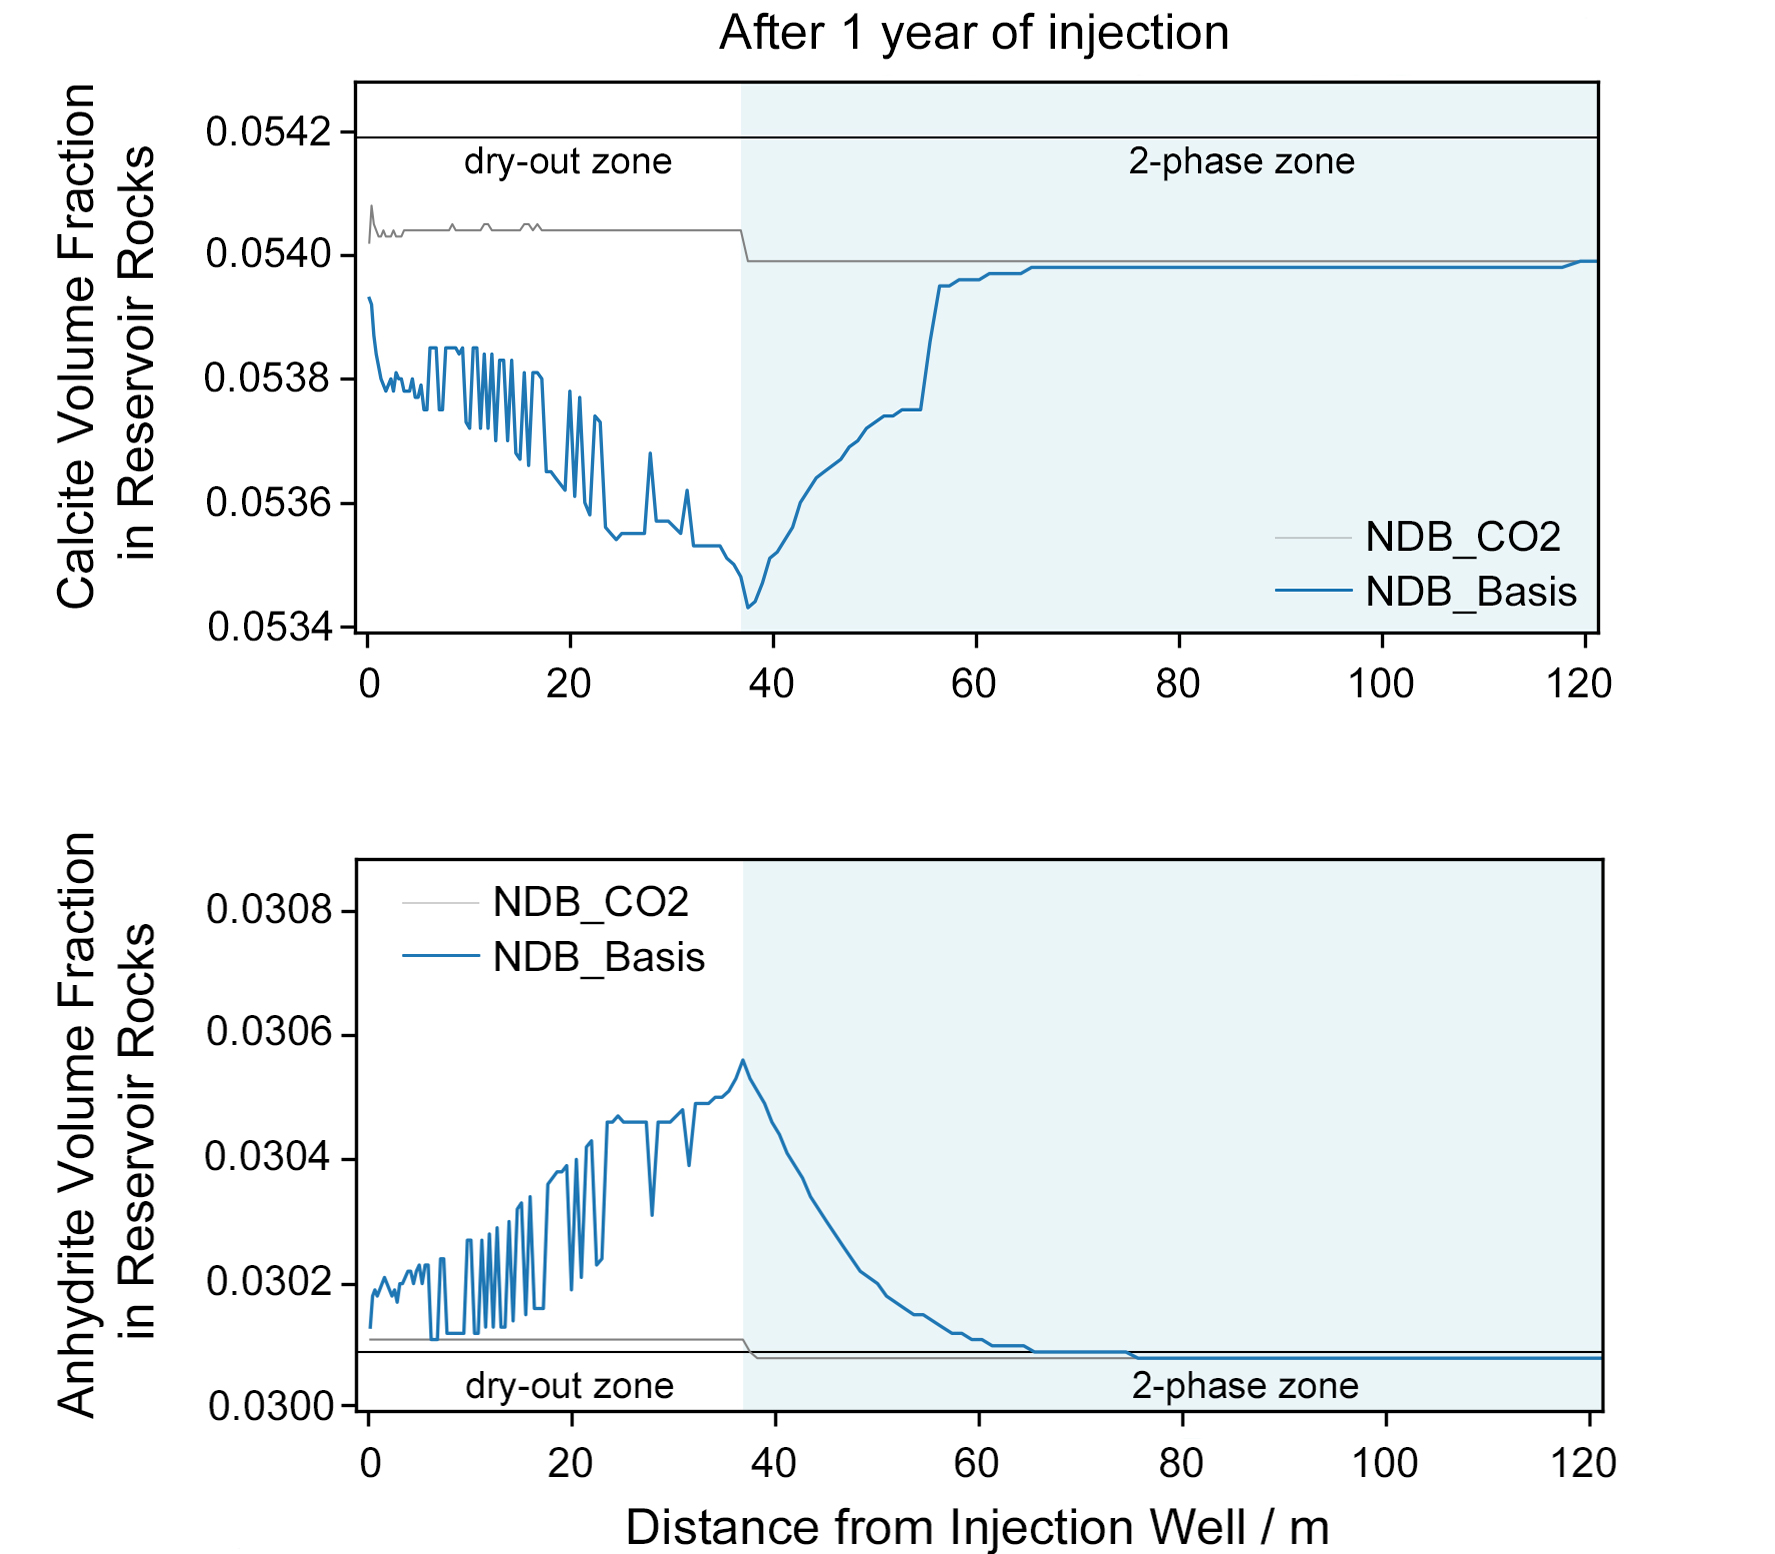
  • CO2 migration with time in the storage reservoir was followed by simulating gas saturations. The zone in which the injected CO2 has displaced most of the formation water (indicated by a gas saturation > 0.9) is termed „dry-out zone“. In general, CO2 migration depends on various factors such as injection regime, CO2 stream fluid properties and reservoir rock properties.

  • In the storage reservoir, impurities may
    i) be transported with the migrating CO2 phase,
    ii) diffuse within the CO2 phase,
    iii) dissolve in the formation water,
    iv) react with formation water and/or reservoir rocks
    (click on arrow button for for details)

    depending, among other things, on the compositions of CO2 stream, formation water and reservoir rocks.
Storage
Beispielbild1

SO2 Dissolution - Solubility, Speciation and Kinetics

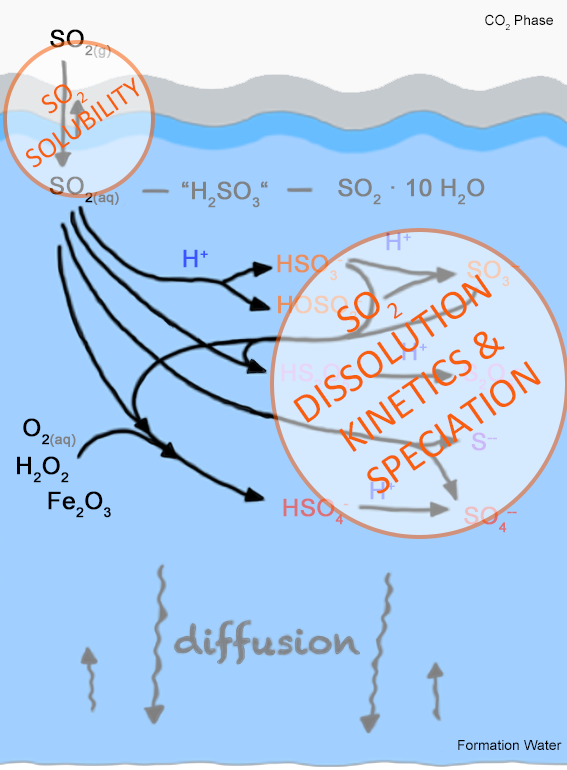
  • When in contact with formation water, impurities contained in the CO2 stream may dissolve in the formation water. How much of each impurity dissolves in the formation water depends on

    i) each impurity‘s solubility at the prevailing conditions (pressure, temperature, salinity),
    ii) each impurity’s dissolution kinetics,
    iii) the migration of the CO2 plume,
    iv) reactions of each impurity within the formation water (= speciation).

  • Reactions of dissolved impurities in the formation water shift the initial phase equilibrium, so that the overall amount of impurity in the formation water is increased.

    For example, potentially occurring speciation reactions of SO2 include

    i) hydration and acid formation: SO2 + H2O → "H2SO3"
    ii) dissociation: "H2SO3" → H+ + HSO3-
    iii) disproportionation: 4 SO2 + 4 H2O → 3 H+ + 3 HSO4- + H2S or
    iv) oxidation: 2 SO2 + O2 + 2 H2O → 2 H+ + 2 HSO4-
Storage

Costs of geological storage of CO2

Estimated Capital Expenditures per Well or Site / Mio € in Scenario RE29% / Mio €
Seismic site investigation, exploration well (drilling), well/injectivity tests ≈ 100
Monitoring
(seismic survey every three years)
67
Injection well
(drilling and completion, material, drilling platform)
30.4 per well 608 (20 wells)
Injection platform 32.5-42.9 per site 163-215 (5 storage sites)
Underwater equipment 29 per site 145 (5 storage sites)
Licenses & concessions 3
Engineering design 3.5
Total ≈ 1100
Estimated Operational Expenditures Mio €
Injection platforms (30 years) 330
Storage

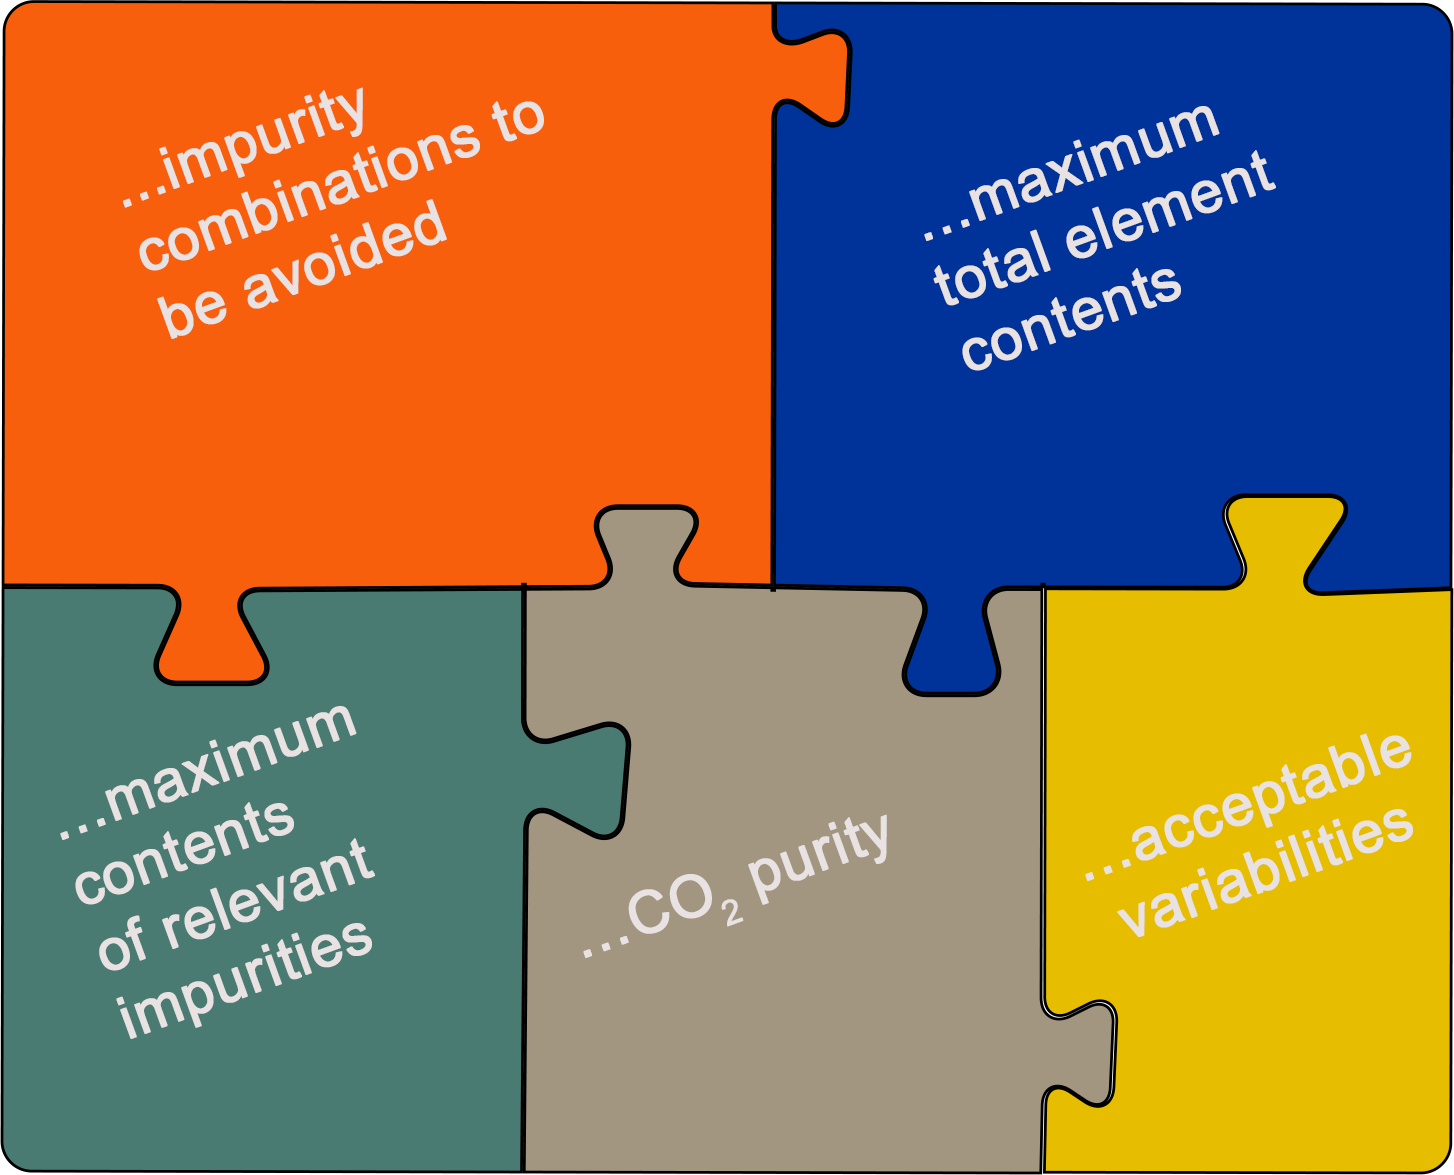
How pure do CO2 streams have to be for accessing CO2 transport and storage networks?


⇒ CLUSTER project team recommends to
define “reasonable minimum composition thresholds“


that CO2 streams should meet for assessing CO2 pipeline networks
(cf. EU CCS DirectiveEU CCS Directive = Directive 2009/31/EC on the geological storage of carbon dioxide stating that “…. Pipelines for CO2 transport should, where possible, be designed so as to facilitate access of CO2 streams meeting reasonable minimum composition thresholds….)

by...
Beispielbild1

For more information, see www.bgr.bund.de/CLUSTER-EN
Start