CLUSTER Homepage
CLUSTER Homepage

Glossary
| Scenario Parameters & Results | ||
|---|---|---|
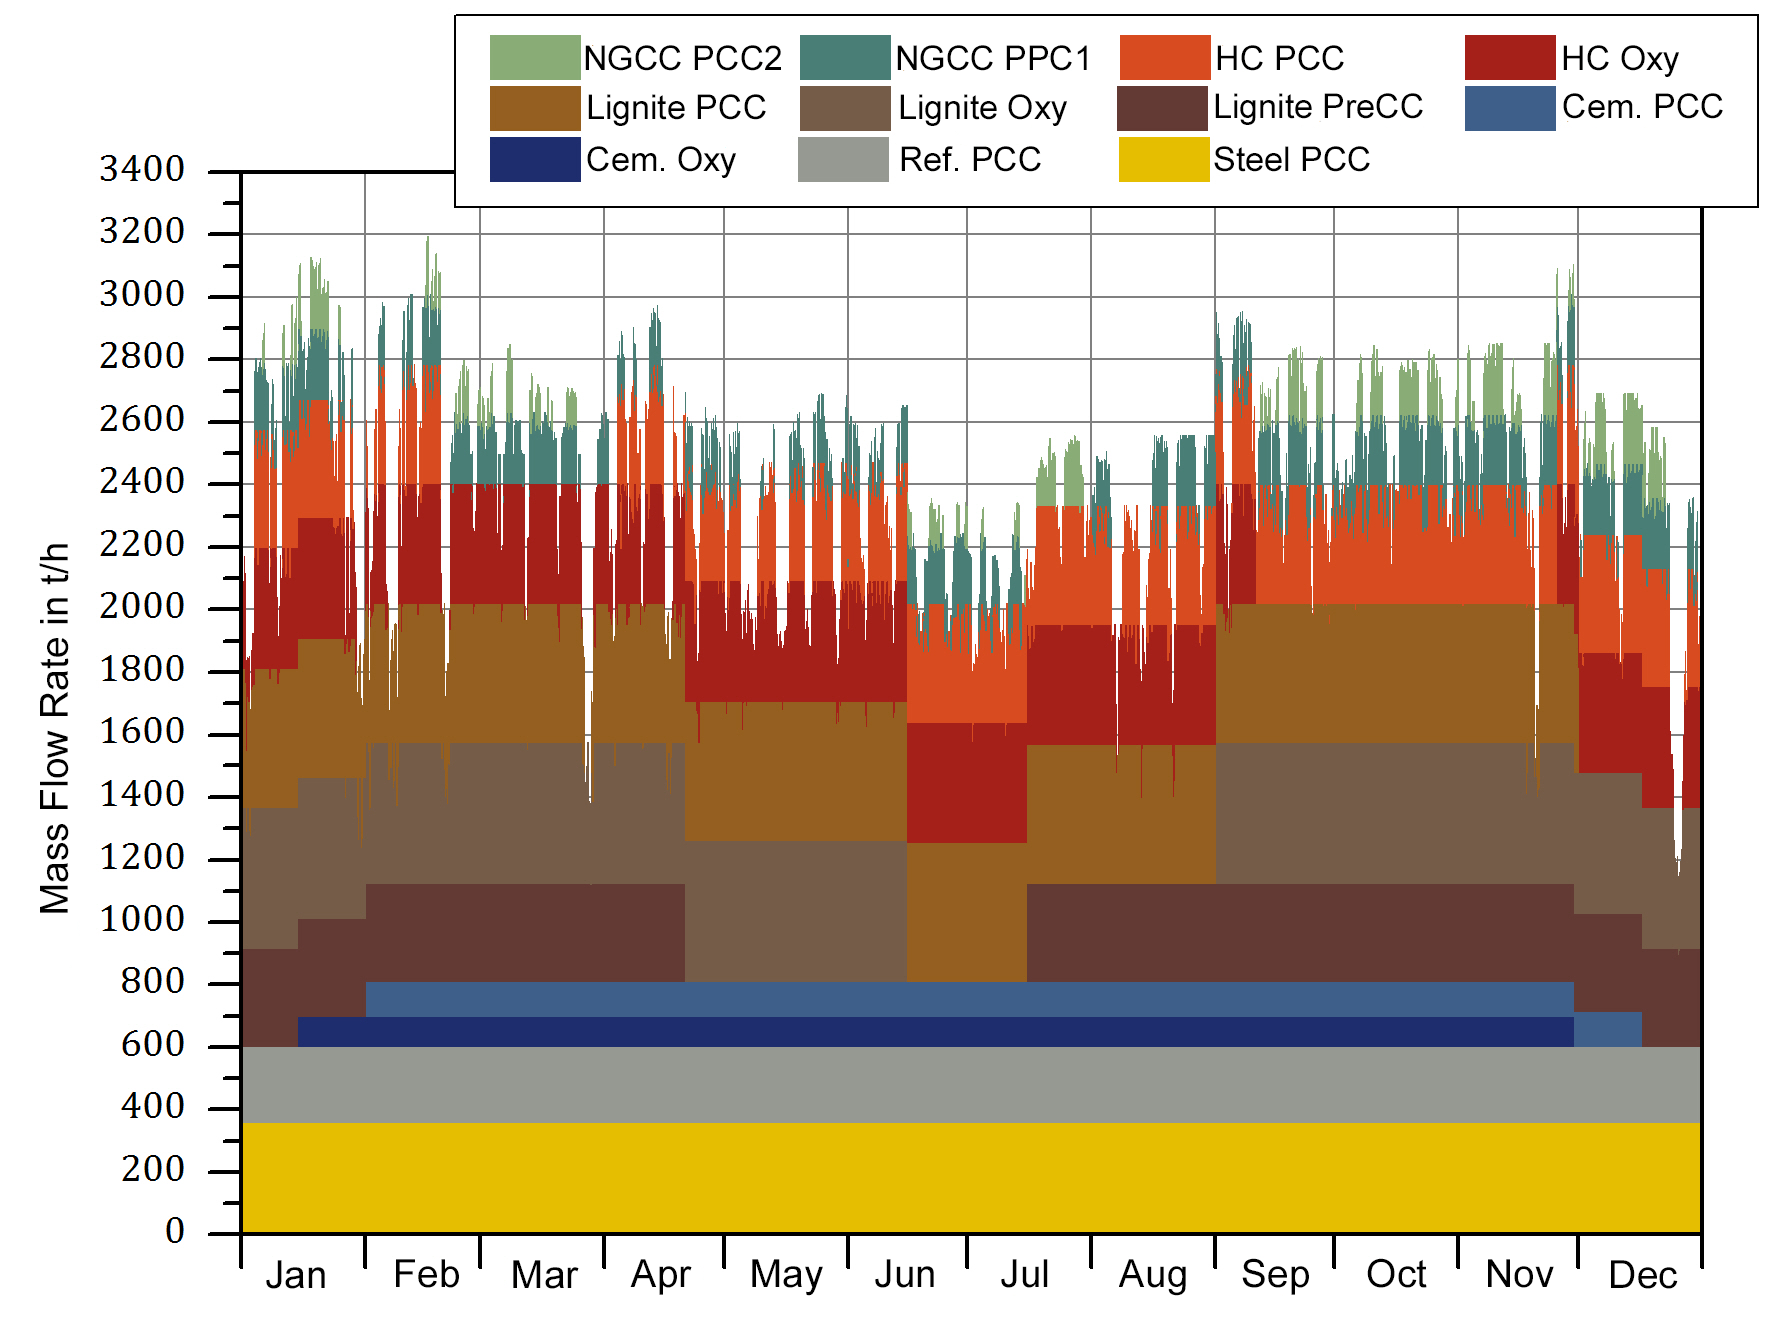
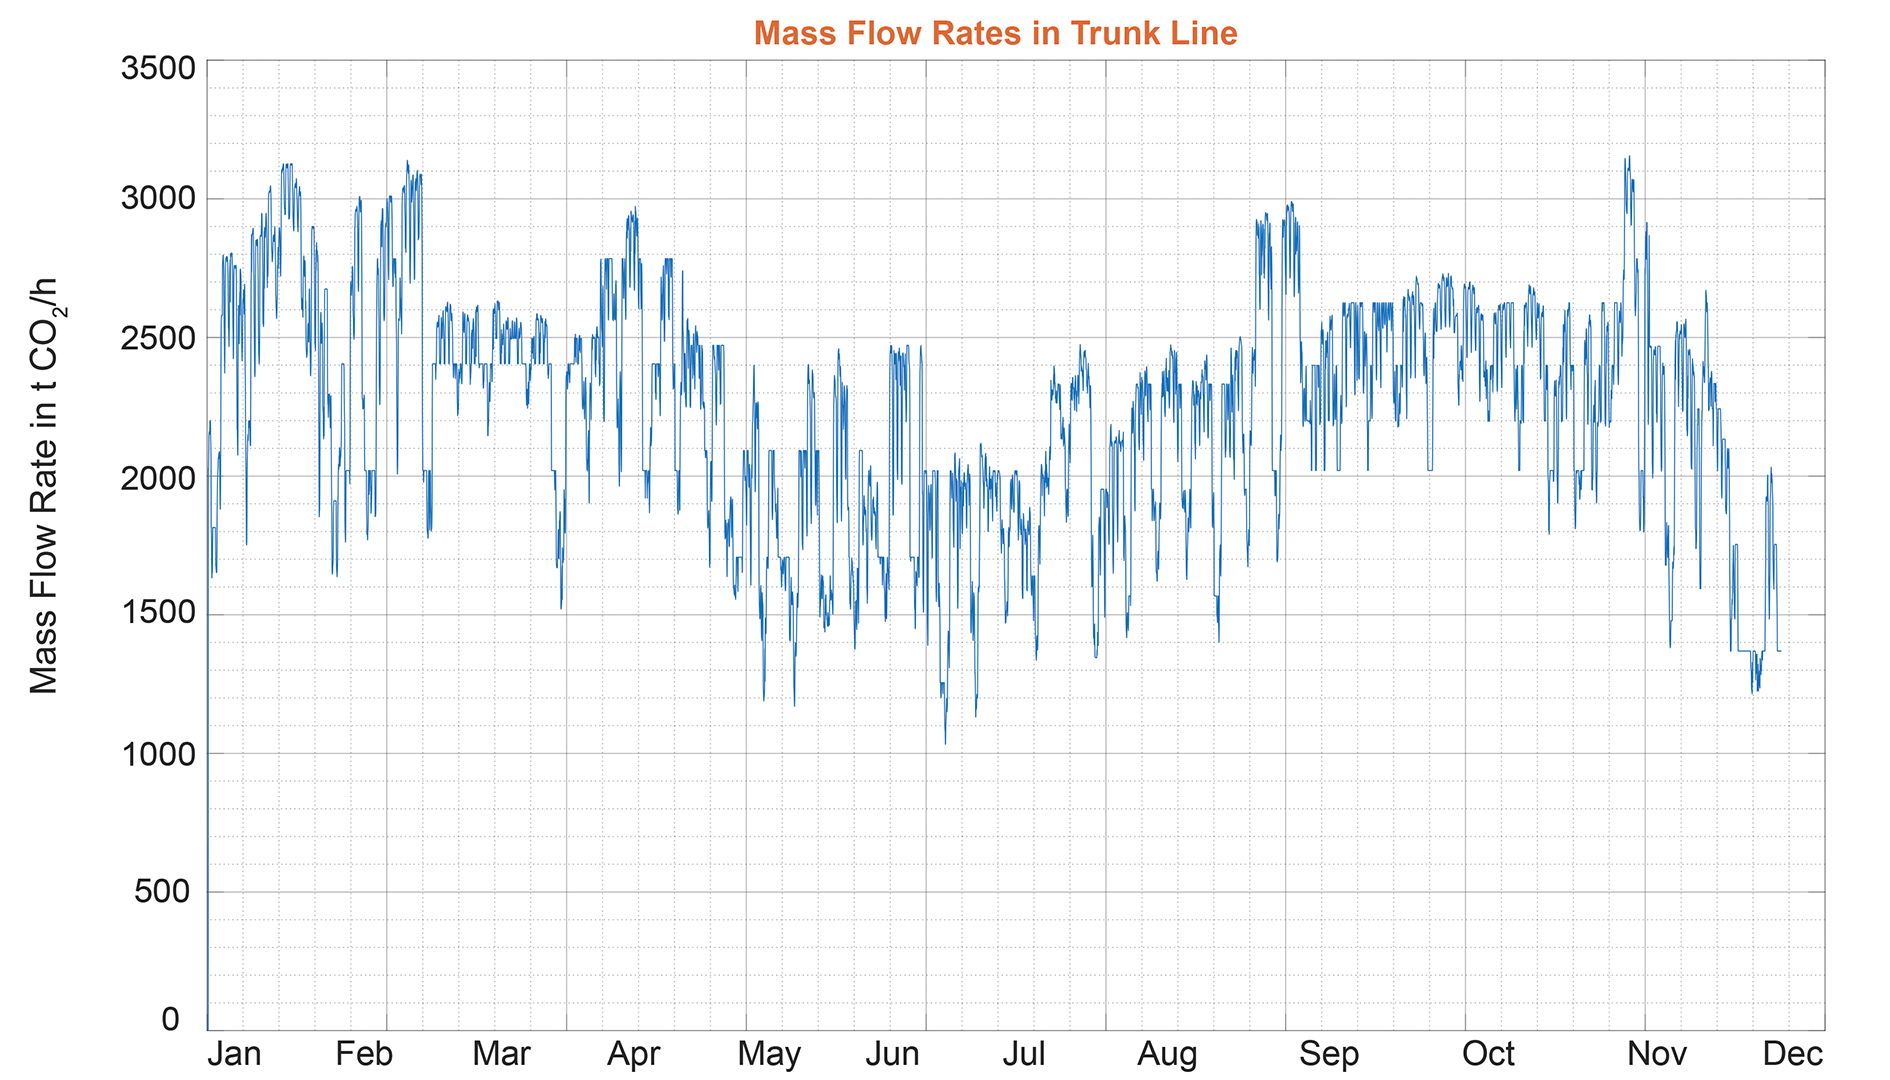
| Pipeline Mass Flow Rate @ Trunk Line Entry |
Ø
Min. Max. |
2197 t/h
1033 t/h 3195 t/h |
| Fuel Mix |  |
|
| Share of Renewable Energy (RE) Sources |  |
|
| Scenario Parameters & Results | ||
|---|---|---|
| Pipeline Mass Flow Rate @ Trunk Line Entry |
Ø
Min. Max. |
1981 t/h
810 t/h 2876 t/h |
| Fuel Mix |  |
|
| Share of Renewable Energy (RE) Sources |  |
|
| Scenario Parameters & Results | ||
|---|---|---|
| Pipeline Mass Flow Rate @ Trunk Line Entry |
Ø
Min. Max. |
2023 t/h
604 t/h 3186 t/h |
| Fuel Mix |  |
|
| Share of Renewable Energy (RE) Sources |  |
|
| Scenario Parameters & Results | ||
|---|---|---|
| Pipeline Mass Flow Rate @ Trunk Line Entry |
Ø
Min. Max. |
1347 t/h
604 t/h 3130 t/h |
| Fuel Mix |  |
|
| Share of Renewable Energy (RE) Sources |  |
|
Glossary

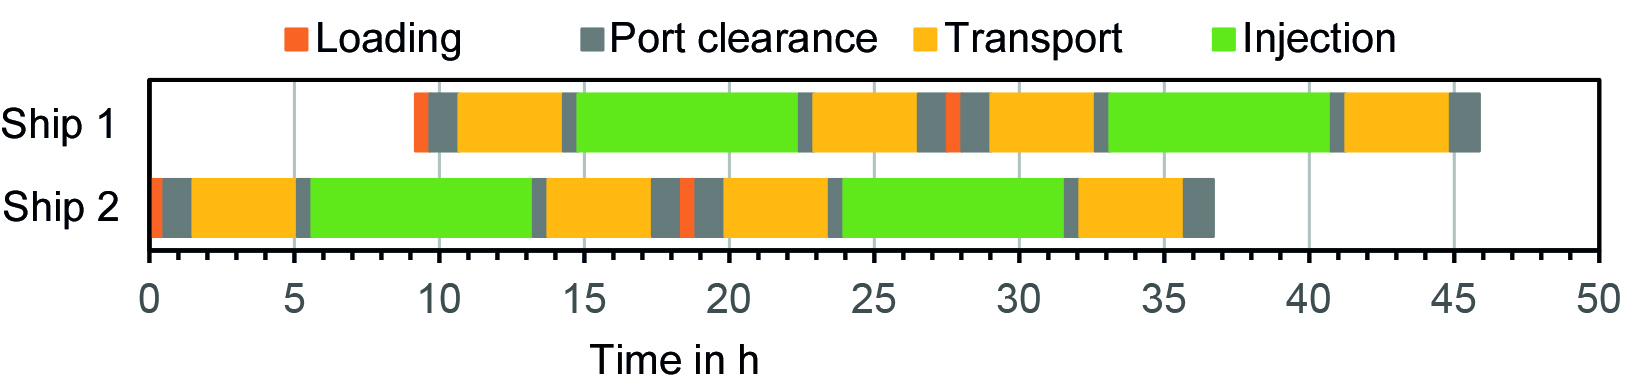
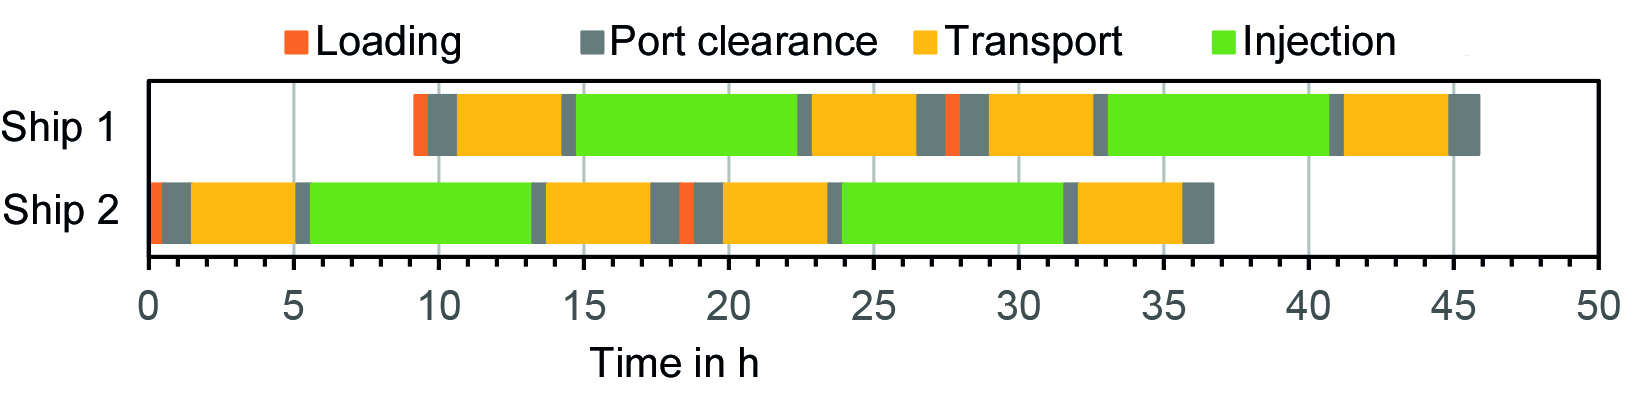
Click for details on Ship Transport
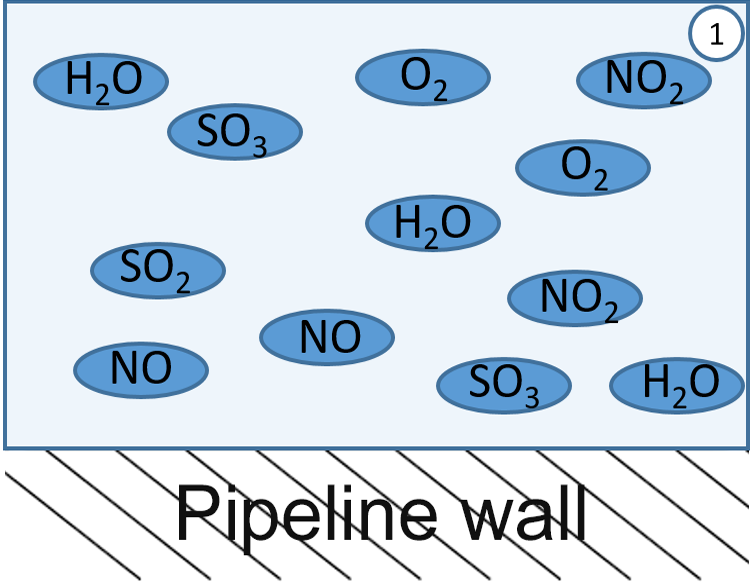
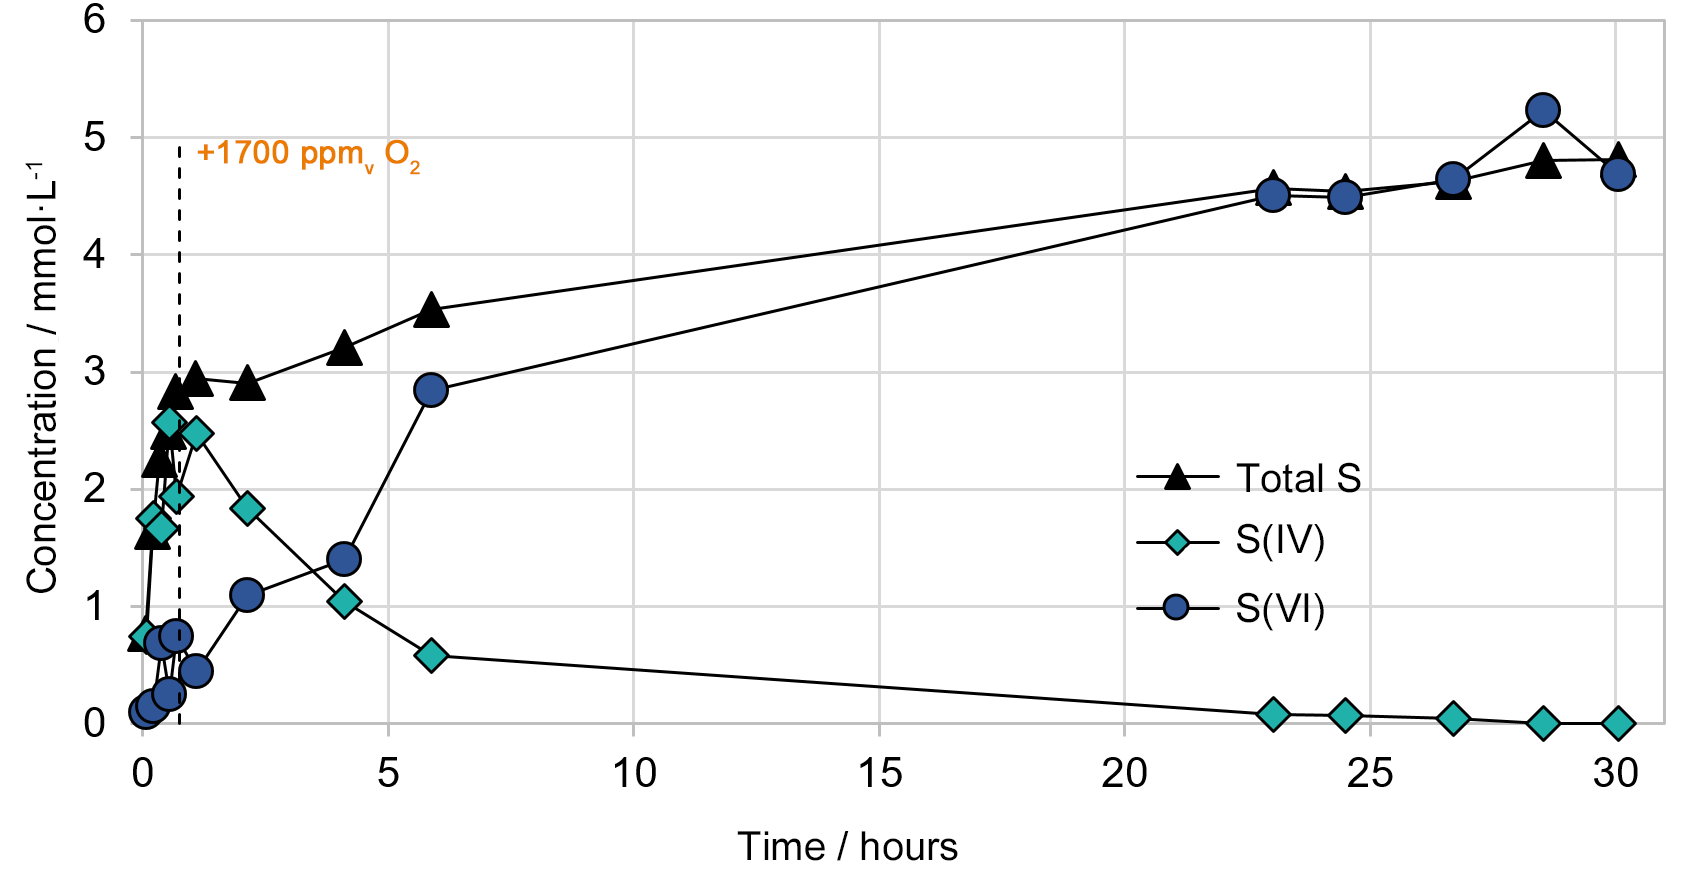
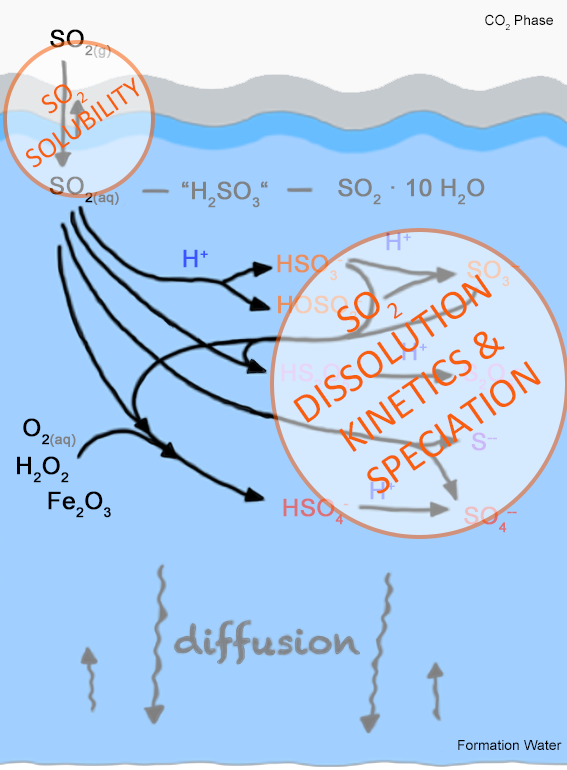
When different impurities are present in the CO2 stream (1), they may react with each other forming new impurities such as nitric acid and sulfuric acid (2).
Depending on pressure (p = 7-15 MPa) and temperature (here T = 283 and 278 K in onshore and offshore parts of trunk line, respectively), these acids can condense and form highly acidic droplets on the pipeline wall (3).
If the droplets spread and stay on the pipeline wall, reactive wetting may occur involving corrosion of the pipeline wall (4). For further details klick the boxes below.
Short Name: L485M or X70M
Characteristics:
Commercial pipeline steel (onshore transport of natural gas); composition analogous to 1.0582, but with different microstructure, i.e. contains i.a. ≤ 1.70 % Mn, ≤ 0.50 % Cr, ≤ 0.50 % Mo, ≤ 0.50 % Ni, ≤ 0.50 % Cu
Short Name: L360N or X52N
Characteristics:
Commercial pipeline steel (onshore transport of natural gas); composition analogous to 1.8977, but with different microstructure, i.e. contains i.a. ≤ 1.40 % Mn, ≤ 0.30 % Cr, ≤ 0.15 % Mo, ≤ 0.30 % Ni, ≤ 0.50 % Cu
Other names: X3CrNiMo13-4, AISI 415, UNS S41500
Characteristics:
Chromium-nickel stainless steel with additional molybdenum; used for oil and petrochemical industries, pumps and compressor components etc.; contains i.a. ≤ 1.5 % Mn, 12-14 % Cr, 0.3-0.7 % Mo, 3.5-4.5 % Ni
Short Name: X1NiCrMoCu32-28-7, UNS N08031
Characteristics: Iron-nickel-chromium-molybdenum high alloyed steel with the addition of nitrogen; used for chemical industry, acid gas applications in the oil and gas industry as well as for transport and storage containers of hazardous goods; contains i.a. ≤ 2.0 % Mn, 26-28 % Cr, 6-7 % Mo, 30-32 % Ni, 1-1.4 % Cu


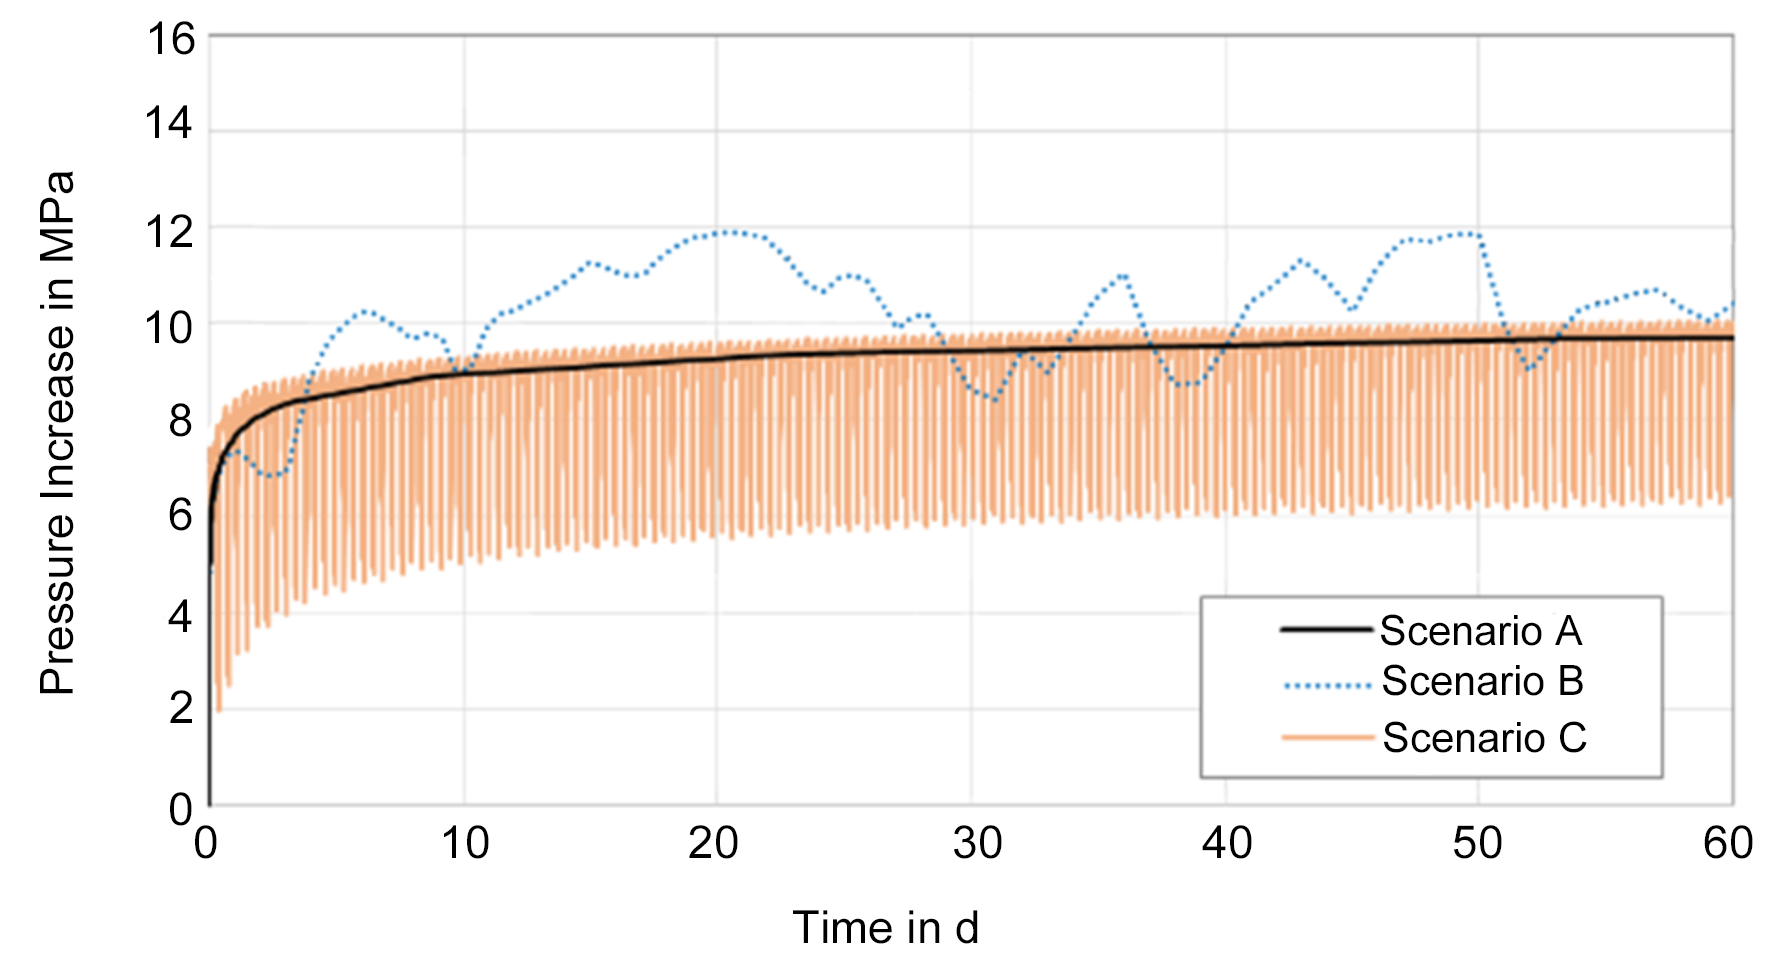
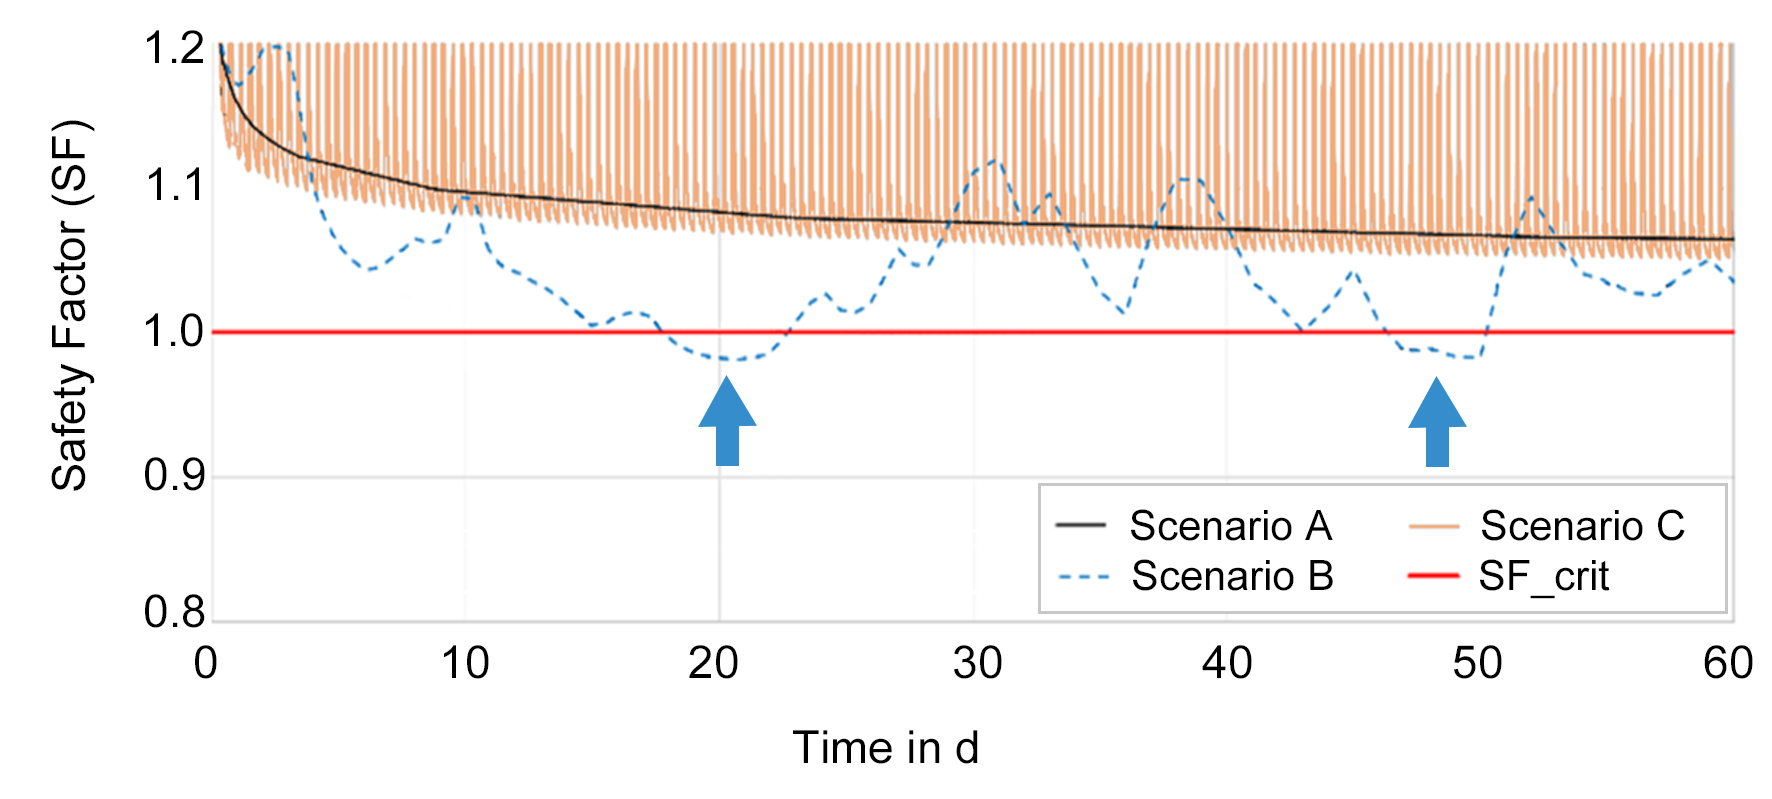
| Scenario A: | Constant mass flow rate of 450 t/h (for injection of 1/5 of total annual amount); |
| Scenario B: | Variable mass flow rate (fluctuations according to energy scenario RE29%) |
| Scenario C: | Cyclically fluctuating mass flow rate (e.g. from ship transport supply) |

| Estimated Capital Expenditures | per Well or Site / Mio € | in Scenario RE29% / Mio € |
|---|---|---|
| Seismic site investigation, exploration well (drilling), well/injectivity tests | ≈ 100 | |
| Monitoring (seismic survey every three years) |
67 | |
| Injection well (drilling and completion, material, drilling platform) |
30.4 per well | 608 (20 wells) |
| Injection platform | 32.5-42.9 per site | 163-215 (5 storage sites) |
| Underwater equipment | 29 per site | 145 (5 storage sites) |
| Licenses & concessions | 3 | |
| Engineering design | 3.5 | |
| Total | ≈ 1100 |
| Estimated Operational Expenditures | Mio € |
|---|---|
| Injection platforms (30 years) | 330 |
⇒ CLUSTER project team recommends to
define “reasonable minimum composition thresholds“
that CO2 streams should meet for assessing CO2 pipeline networks
(cf. EU CCS DirectiveEU CCS Directive = Directive 2009/31/EC on the geological storage of carbon dioxide stating that “…. Pipelines for CO2 transport should, where possible, be designed so as to facilitate access of CO2 streams meeting reasonable minimum composition thresholds….)
by...

Copyright © | Contact | Legal Notice | Privacy Policy | Site Map
| Plant Type | Power Plant |
|---|---|
| Fuel | Lignite |
| Capture Technology | Oxyfuel |
| Used Abbreviation | Lignite Oxy |
| Block Size | 445.9 MWnet |
| Feed-in Character | Variable: 0; 50-100% |
| Pipeline Mass Flow Rate | 0-452.16 t/h |
| CO2 Stream Composition in % | 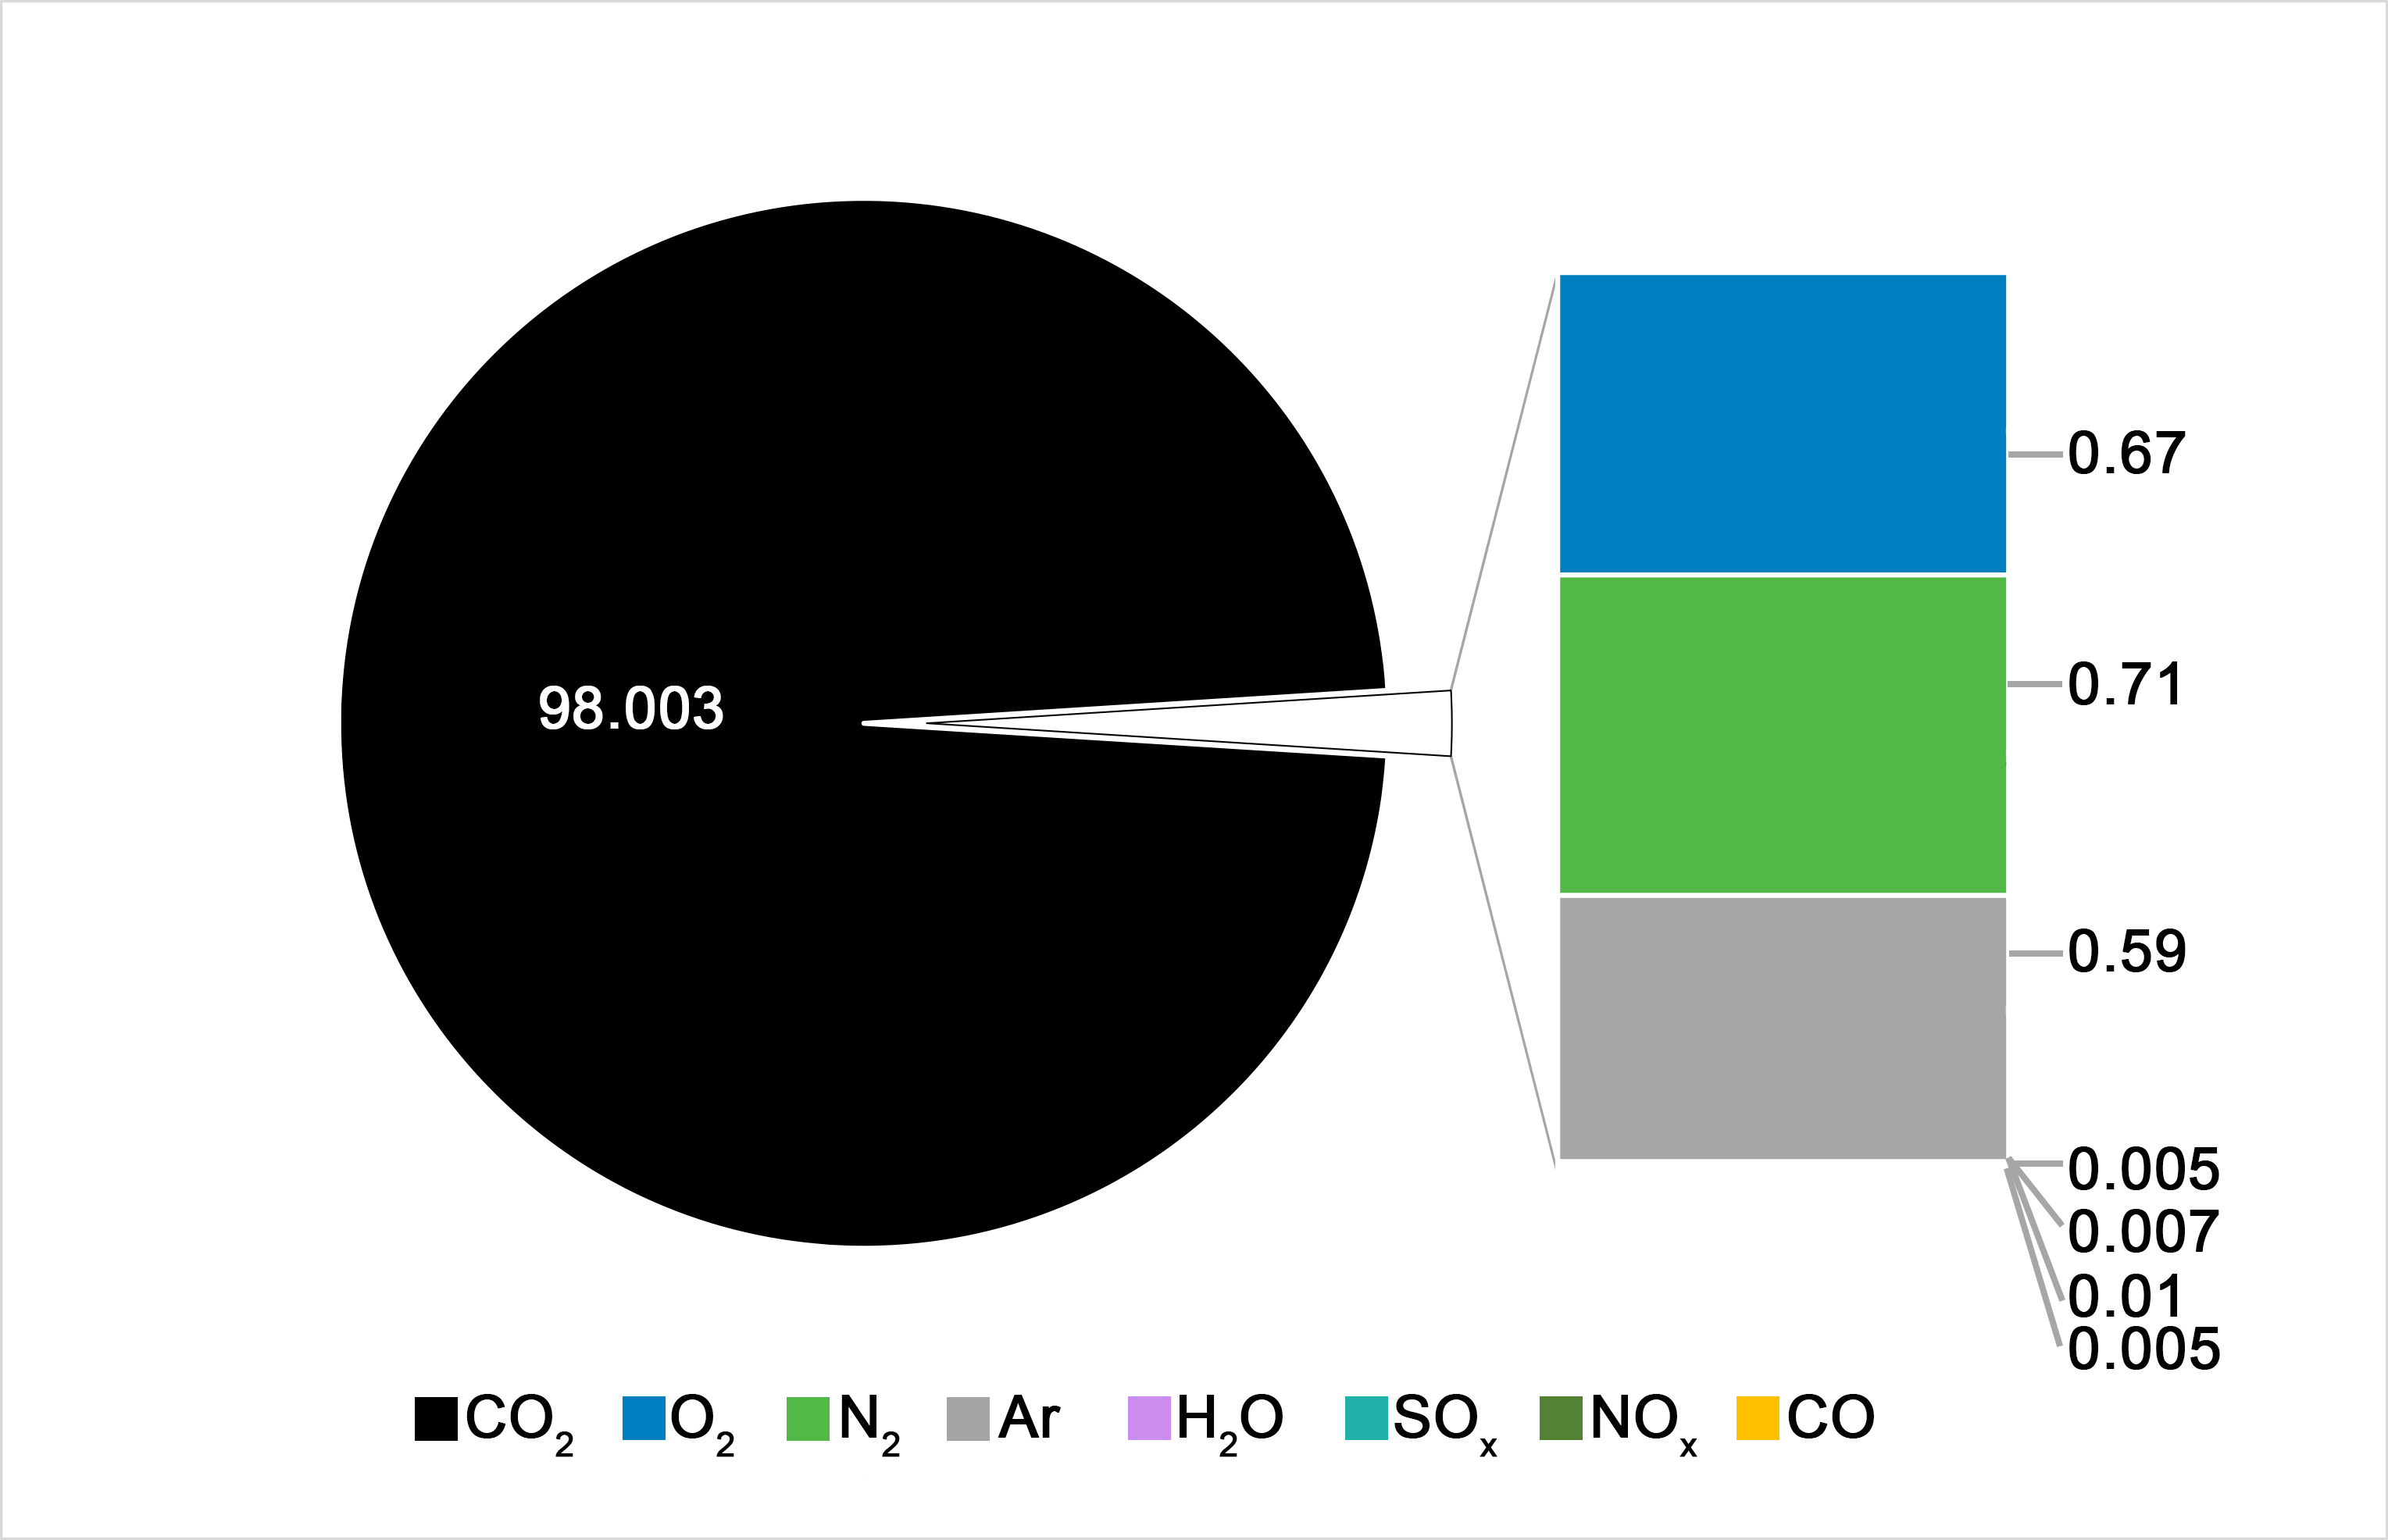 |
| Plant Type | Power Plant |
|---|---|
| Fuel | Lignite |
| Capture Technology | Post-Combustion Capture (PCC) |
| Used Abbreviation | Lignite PCC |
| Block Size | 395.7 MWnet |
| Feed-in Character | Variable: 0; 50-100% |
| Pipeline Mass Flow Rate | 0-445.68 t/h |
| CO2 Stream Composition in % | 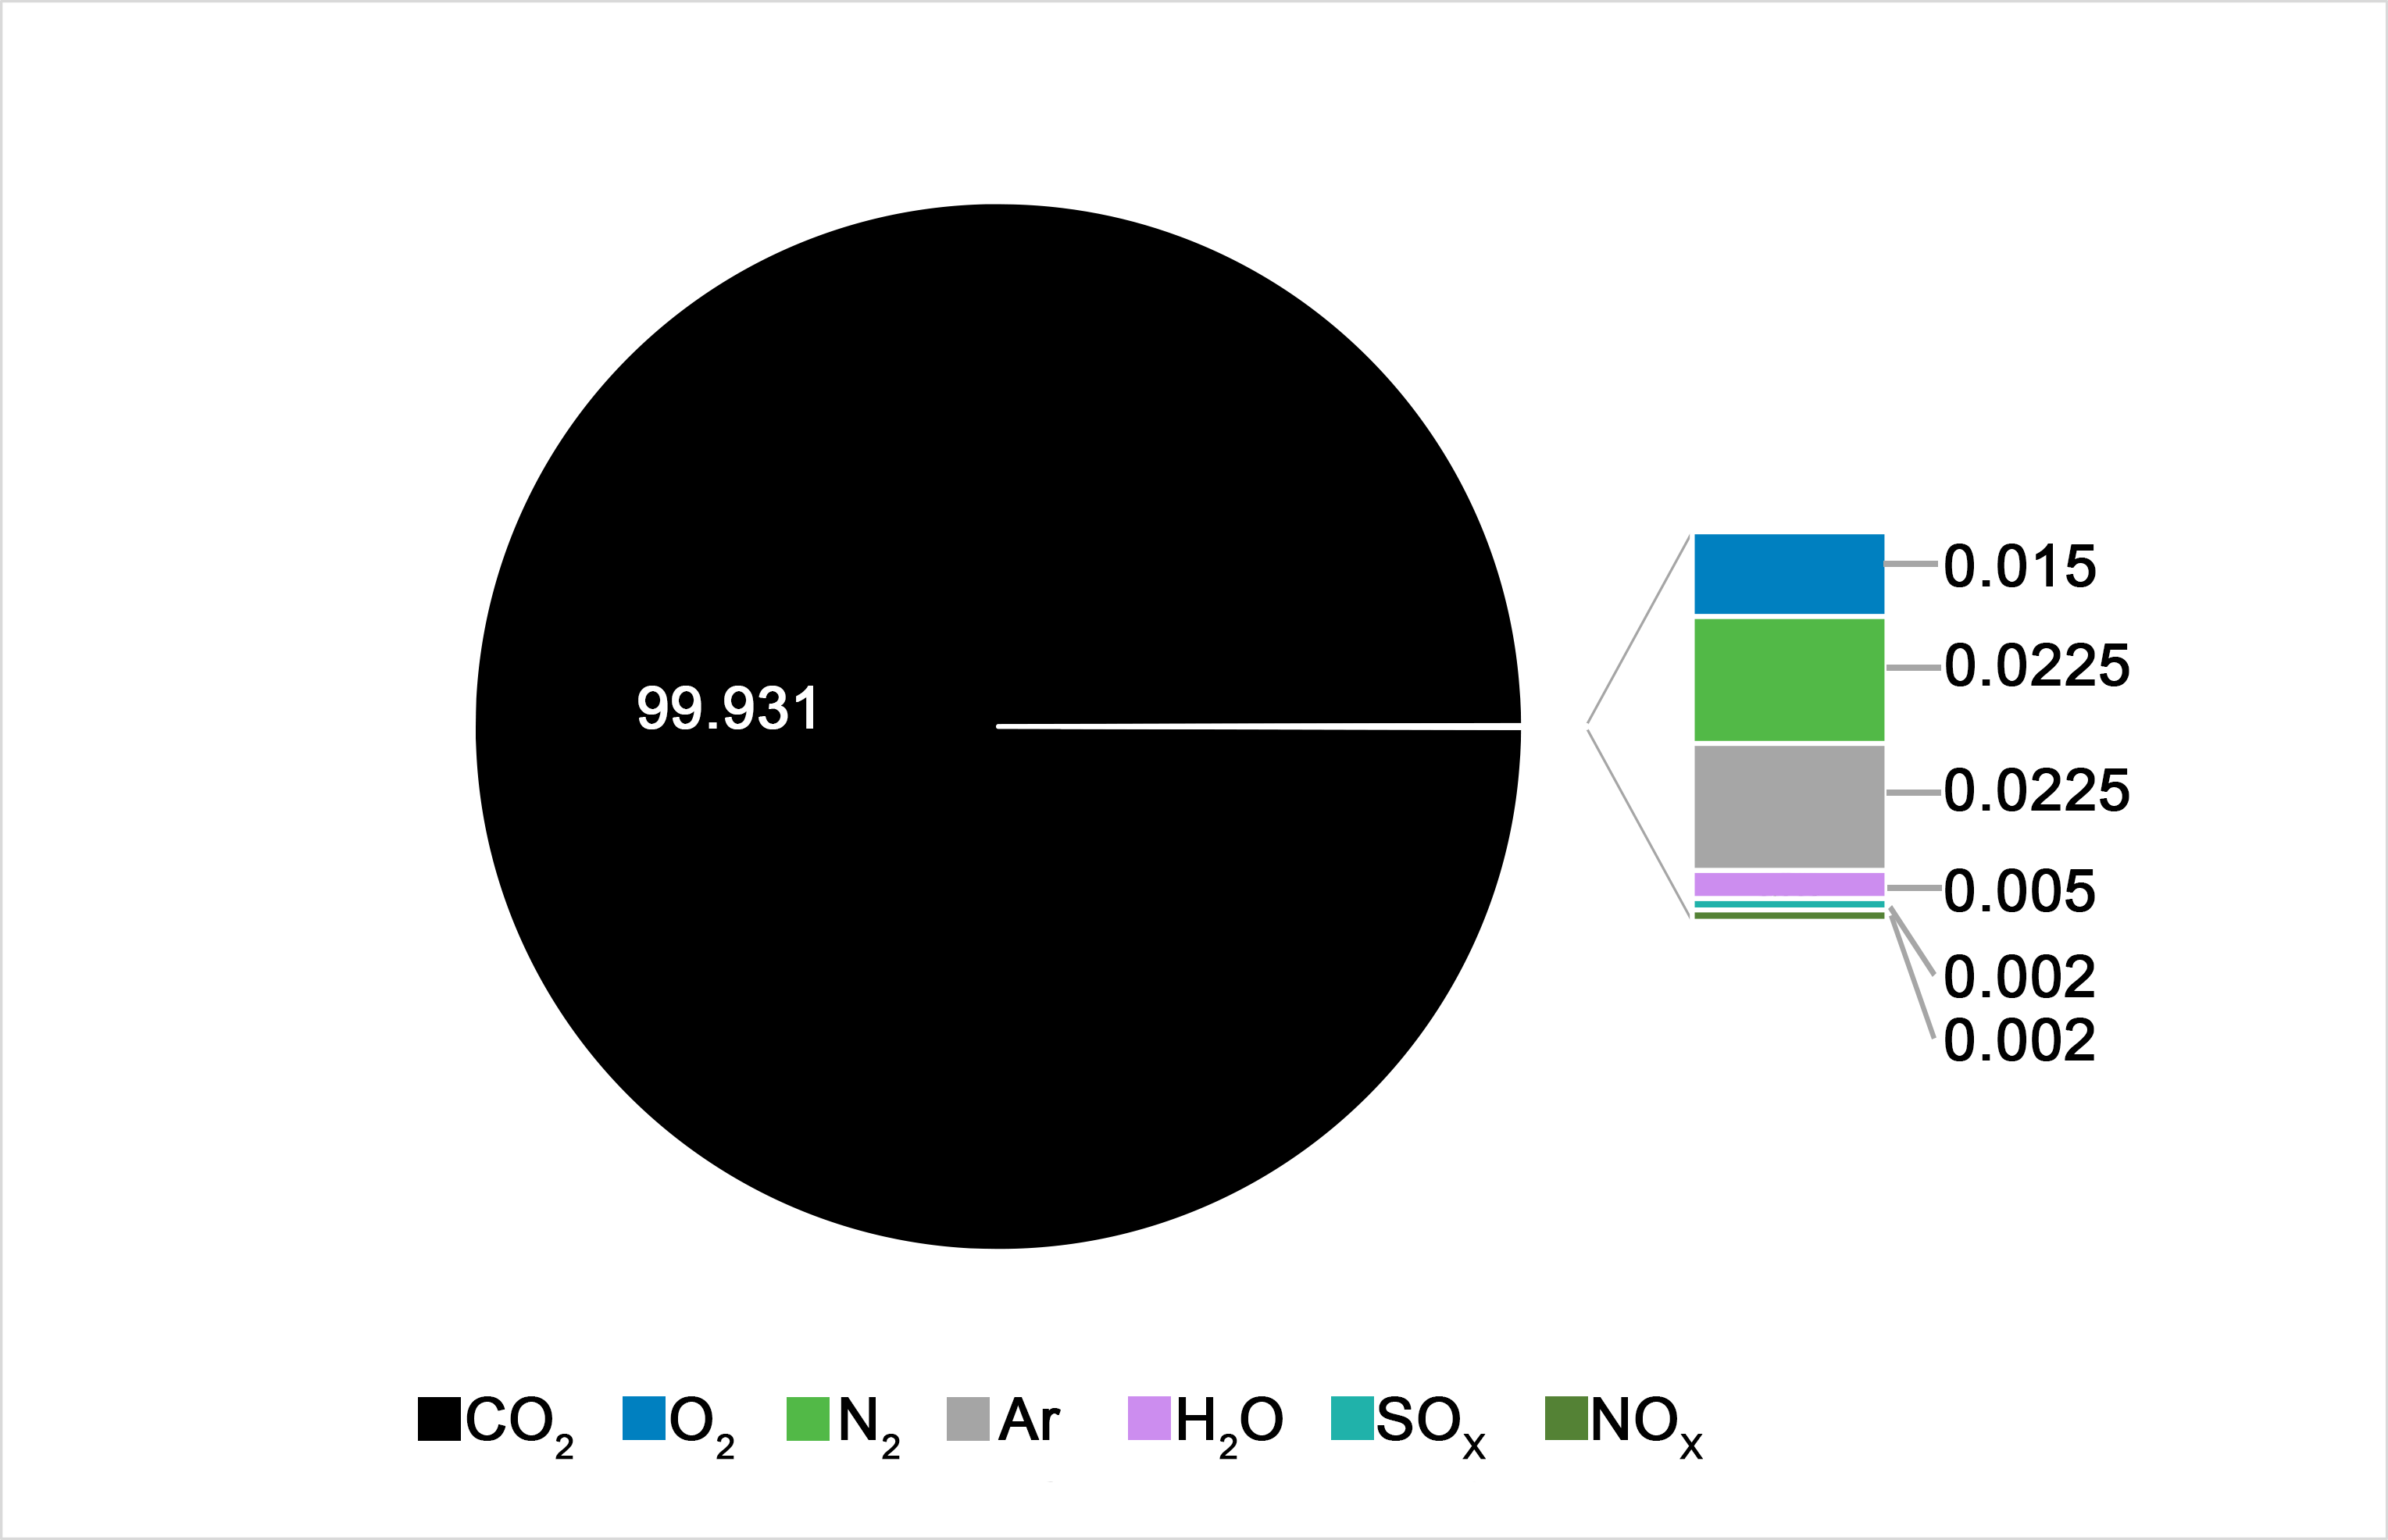 |
| Plant Type | Power Plant |
|---|---|
| Fuel | Lignite |
| Capture Technology | Pre Combustion |
| Used Abbreviation | Lignite PreCC |
| Block Size | 324.0 MWnet |
| Feed-in Character | Variable: 0; 50-100% |
| Pipeline Mass Flow Rate | 0-312.48 t/h |
| CO2 Stream Composition in % | 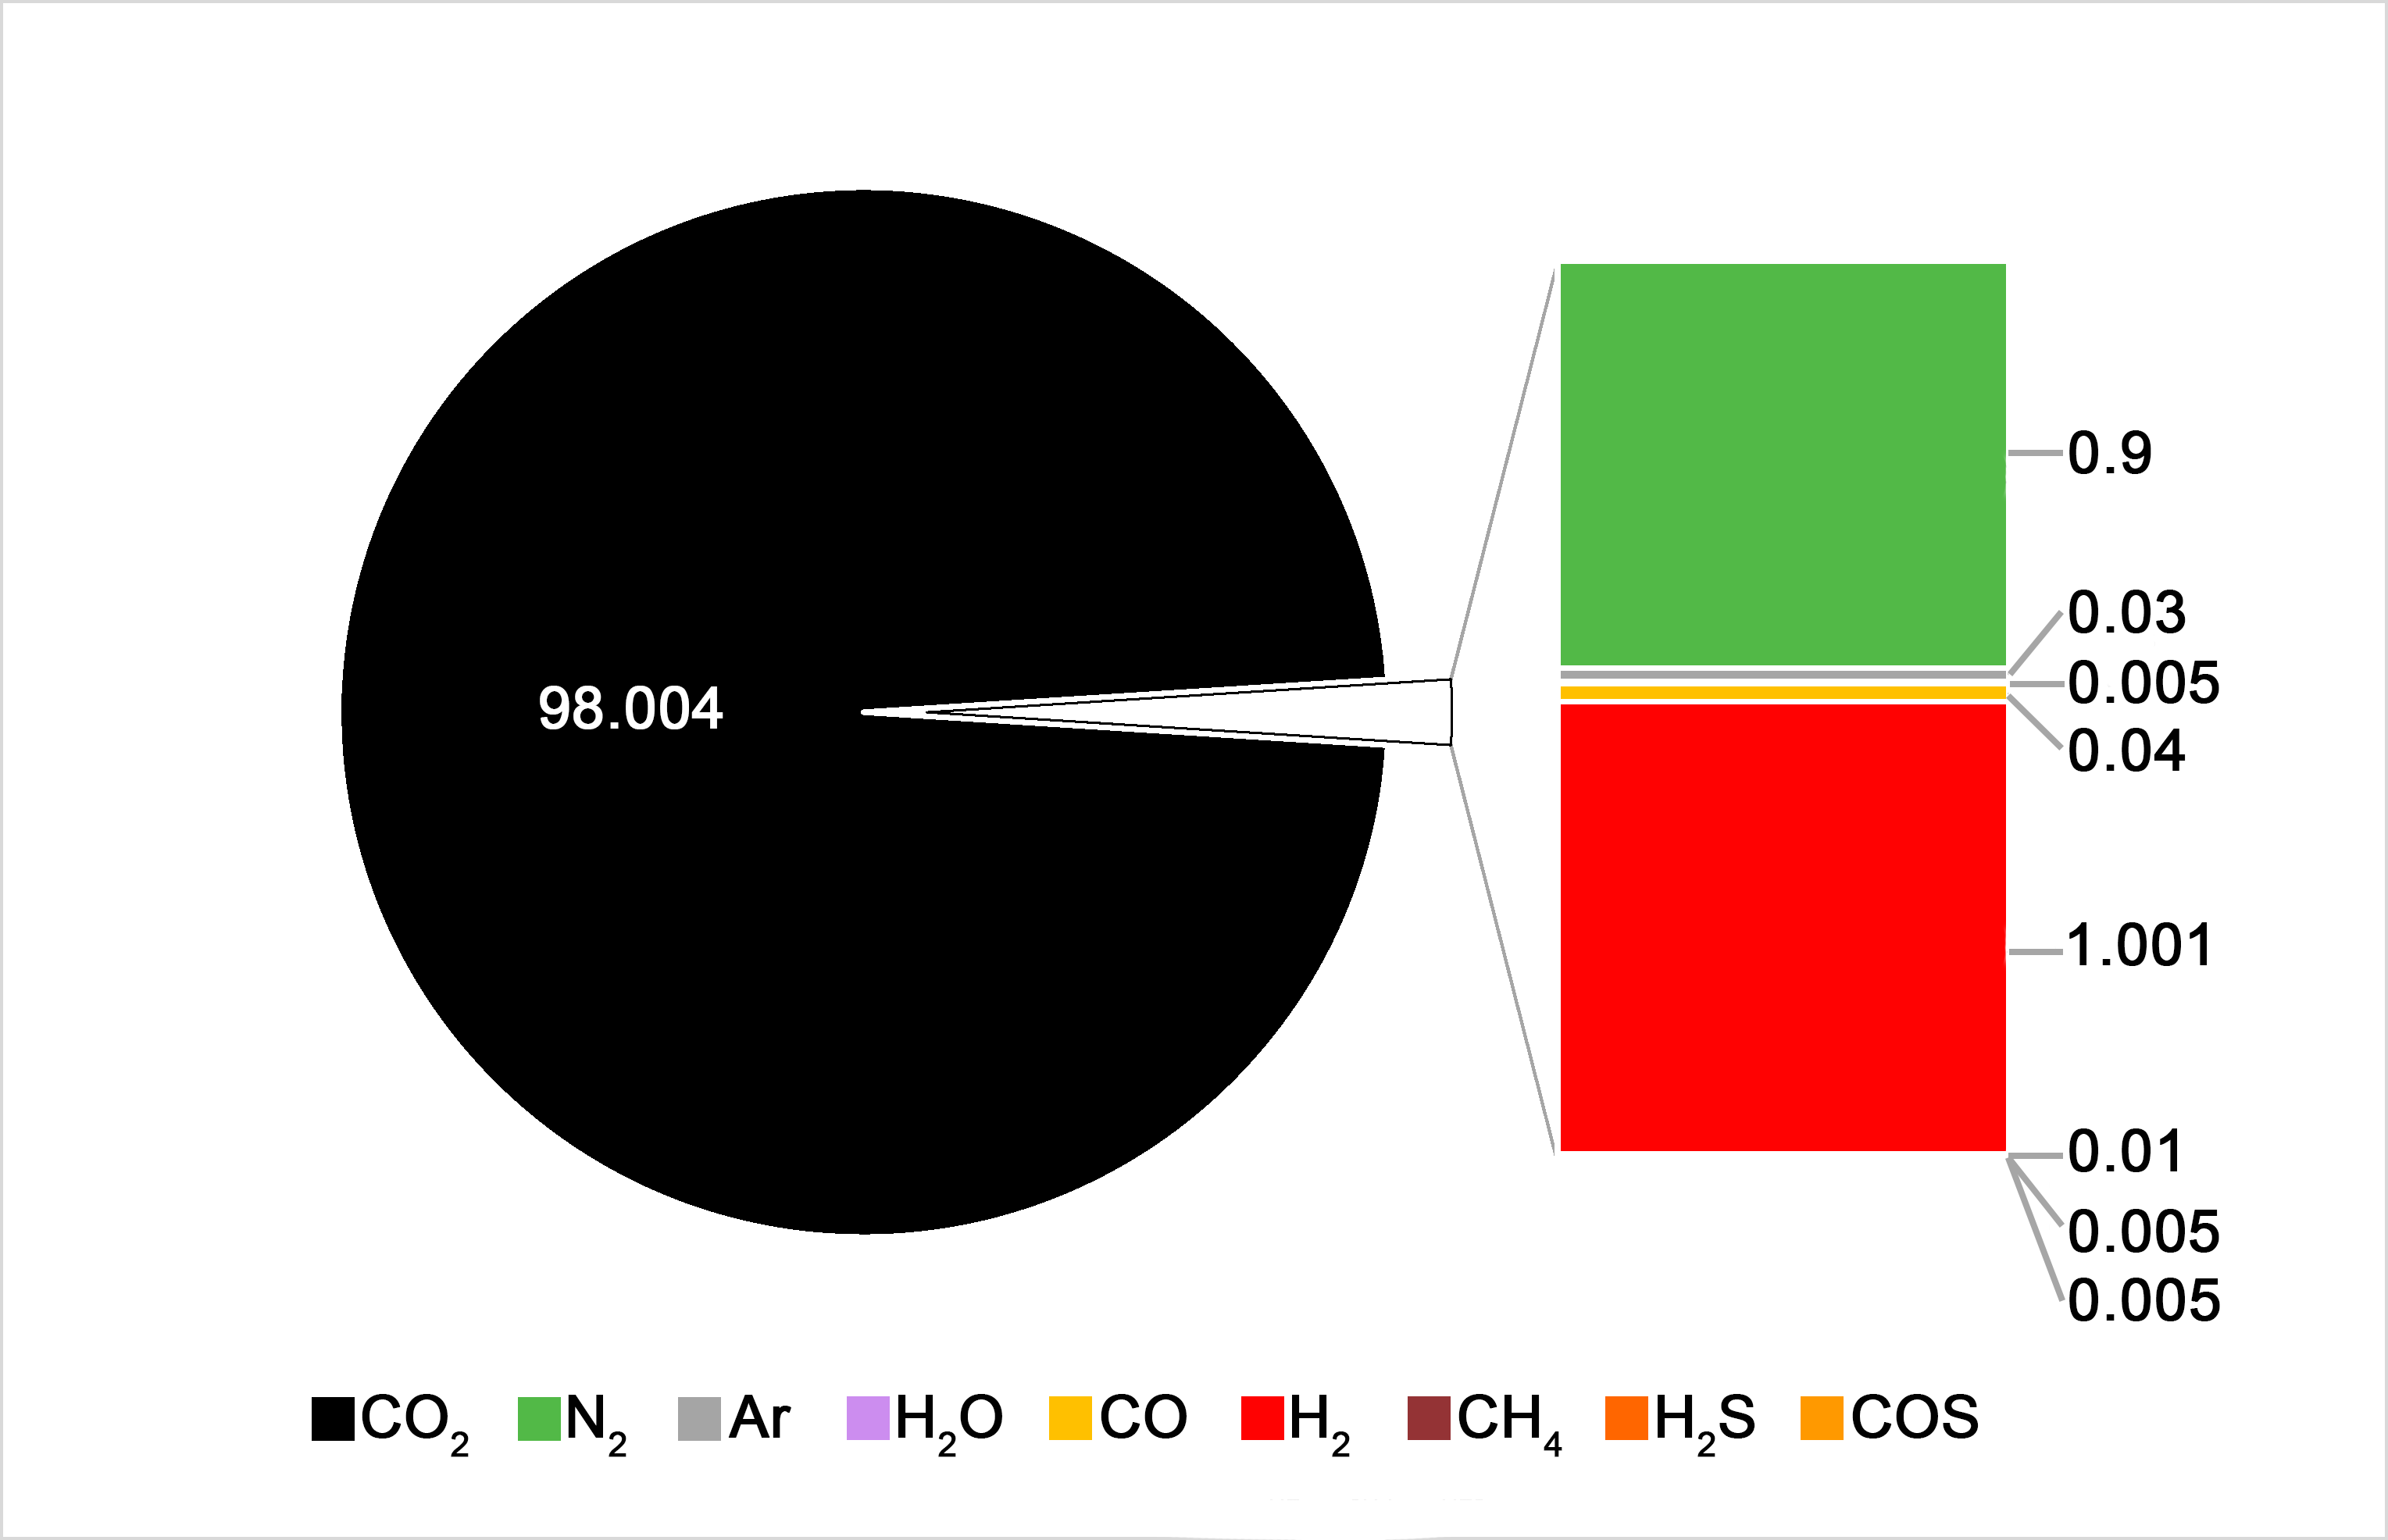 |
| Plant Type | Power Plant |
|---|---|
| Fuel | Natural Gas |
| Capture Technology | Post-Combustion Capture (PCC) |
| Used Abbreviation | NGCC PCC1 |
| Block Size | 633.5 MWnet |
| Feed-in Character | Variable: 0; 40-100% |
| Pipeline Mass Flow Rate | 0-225.72 t/h |
| CO2 Stream Composition in % | |
| Plant Type | Power Plant |
|---|---|
| Fuel | Natural Gas |
| Capture Technology | Post-Combustion Capture (PCC) |
| Used Abbreviation | NGCC PCC2 |
| Block Size | 633.5 MWnet |
| Feed-in Character | Variable: 0; 40-100% |
| Pipeline Mass Flow Rate | 0-225.72 t/h |
| CO2 Stream Composition in % | |
| Plant Type | Refinery |
|---|---|
| Capture Technology | Post-Combustion Capture (PCC) |
| Used Abbreviation | Ref. PCC |
| Block Size | 30 000 t crude oil/d |
| Feed-in Character | Constant: 100% |
| Pipeline Mass Flow Rate | 245.52 t/h |
| CO2 Stream Composition in % | |
| Plant Type | Power Plant |
|---|---|
| Fuel | Hard Coal |
| Capture Technology | Oxyfuel |
| Used Abbreviation | Hard Coal Oxy (HC Oxy) |
| Block Size | 431.9 MWnet |
| Feed-in Character | Variable: 0; 30-100% |
| Pipeline Mass Flow Rate | 0-384.84 t/h |
| CO2 Stream Composition in % | |
| Plant Type | Power Plant |
|---|---|
| Fuel | Hard Coal |
| Capture Technology | Post-Combustion Capture (PCC) |
| Used Abbreviation | Hard Coal PCC (HC PCC) |
| Block Size | 431.9 MWnet |
| Feed-in Character | Variable: 0; 30-100% |
| Pipeline Mass Flow Rate | 0-379.44 t/h |
| CO2 Stream Composition in % | 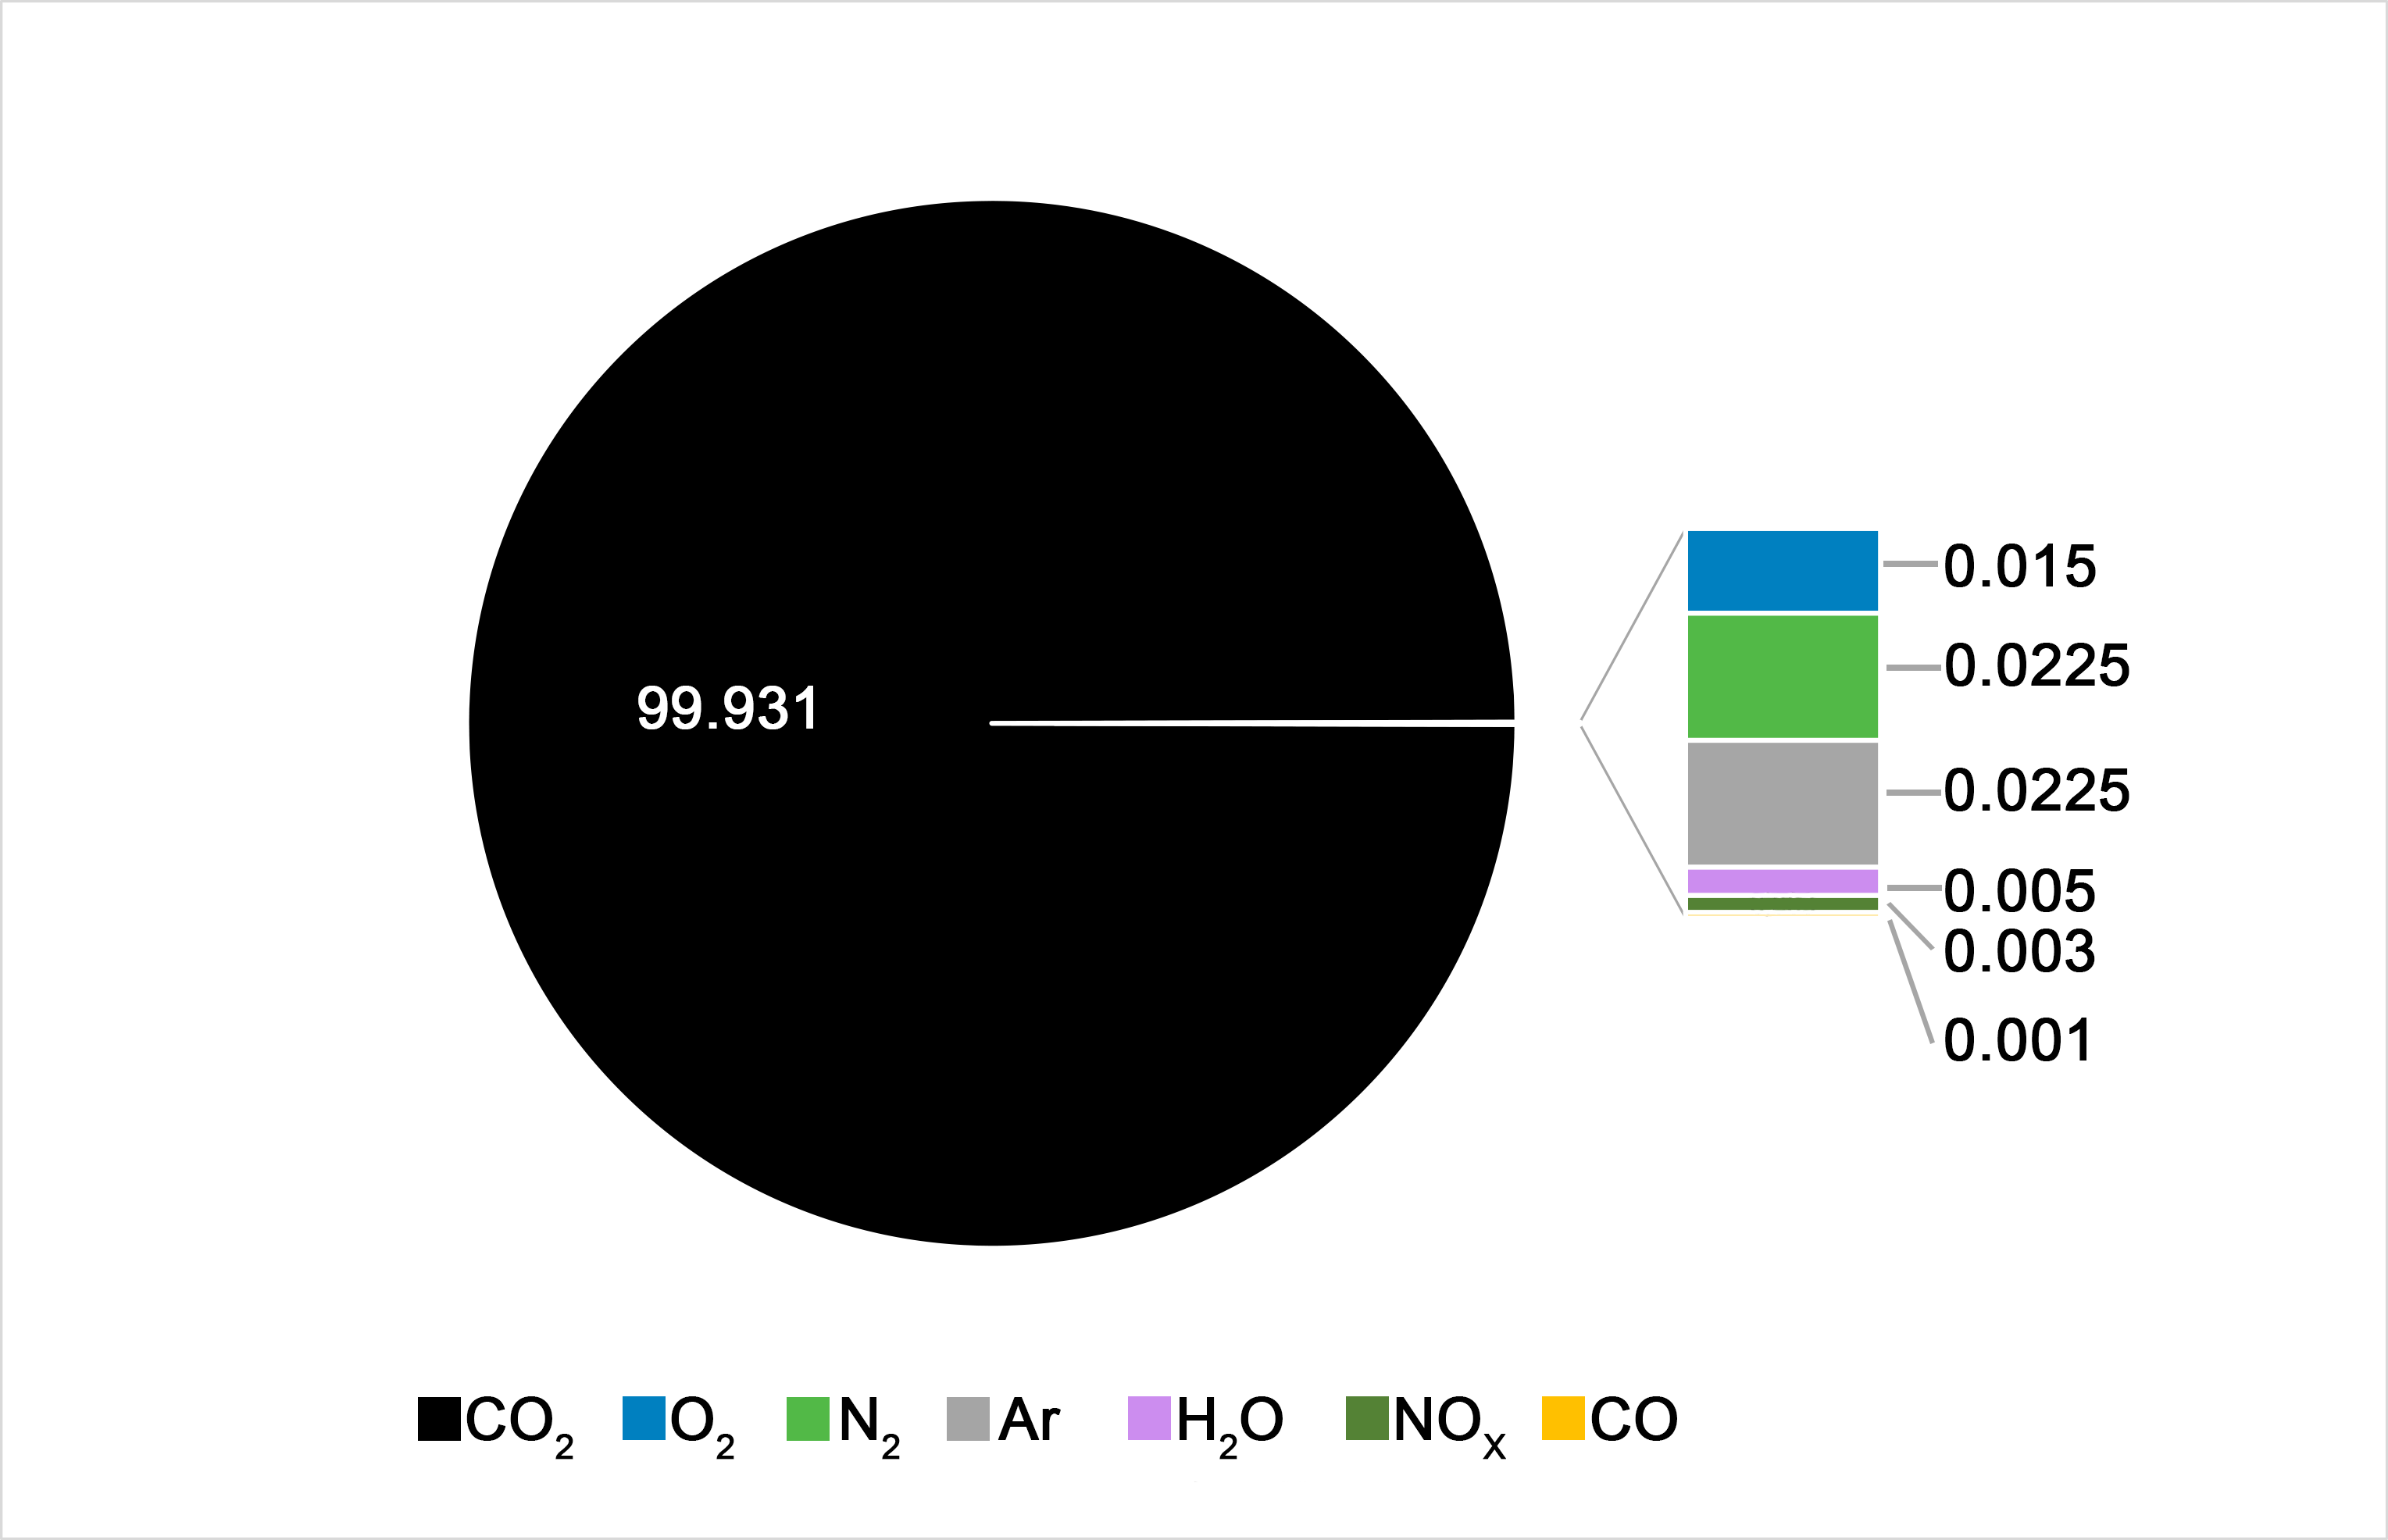 |
| Plant Type | Iron and Steel Mill |
|---|---|
| Capture Technology | Post-Combustion Capture (PCC) |
| Used Abbreviation | Steel PCC |
| Block Size | 6850 t crude steel/d |
| Feed-in Character | Constant: 100% |
| Pipeline Mass Flow Rate | 358.92 t/h |
| CO2 Stream Composition in % | |
| Plant Type | Cement Plant |
|---|---|
| Capture Technology | Oxyfuel |
| Used Abbreviation | Cem. Oxy |
| Block Size | 3000 t clinker/d |
| Feed-in Character | Constant: 0 or 100% |
| Pipeline Mass Flow Rate | 95.76 t/h |
| CO2 Stream Composition in % | 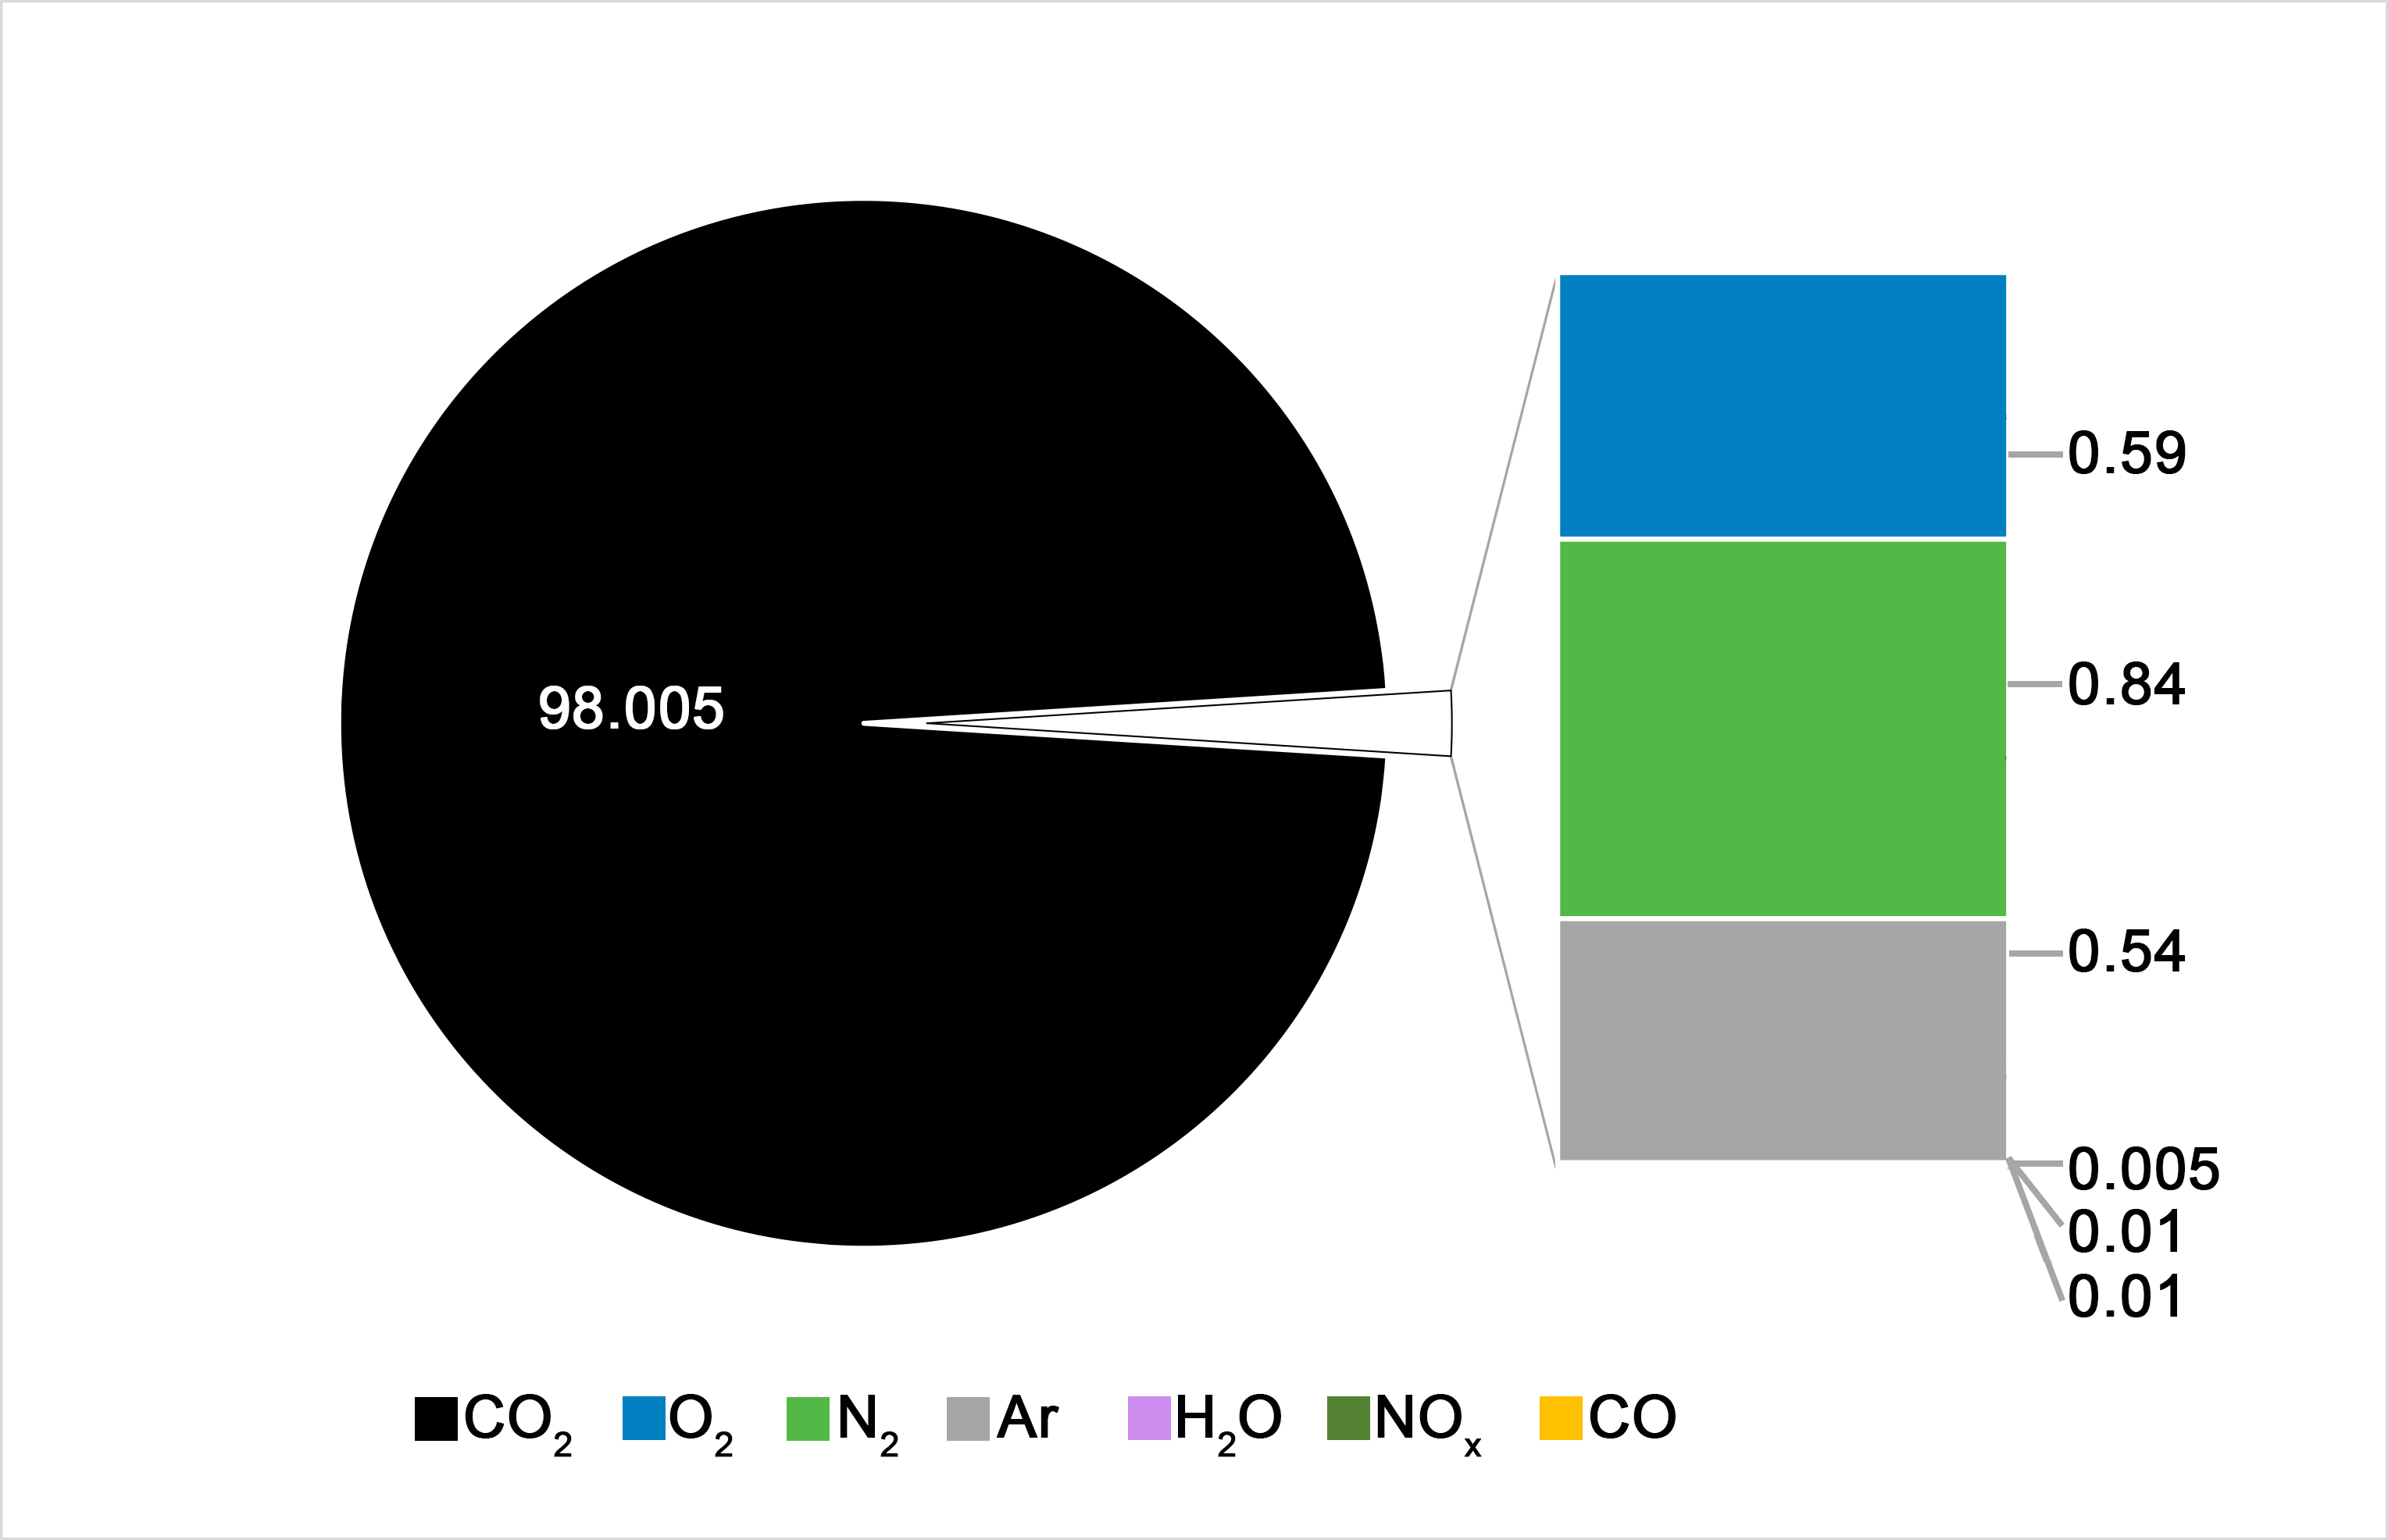 |
| Plant Type | Cement Plant |
|---|---|
| Capture Technology | Post-Combustion Capture (PCC) |
| Used Abbreviation | Cem. PCC |
| Block Size | 3000 t clinker/d |
| Feed-in Character | Constant: 0 or 100% |
| Pipeline Mass Flow Rate | 109.8 t/h |
| CO2 Stream Composition in % | 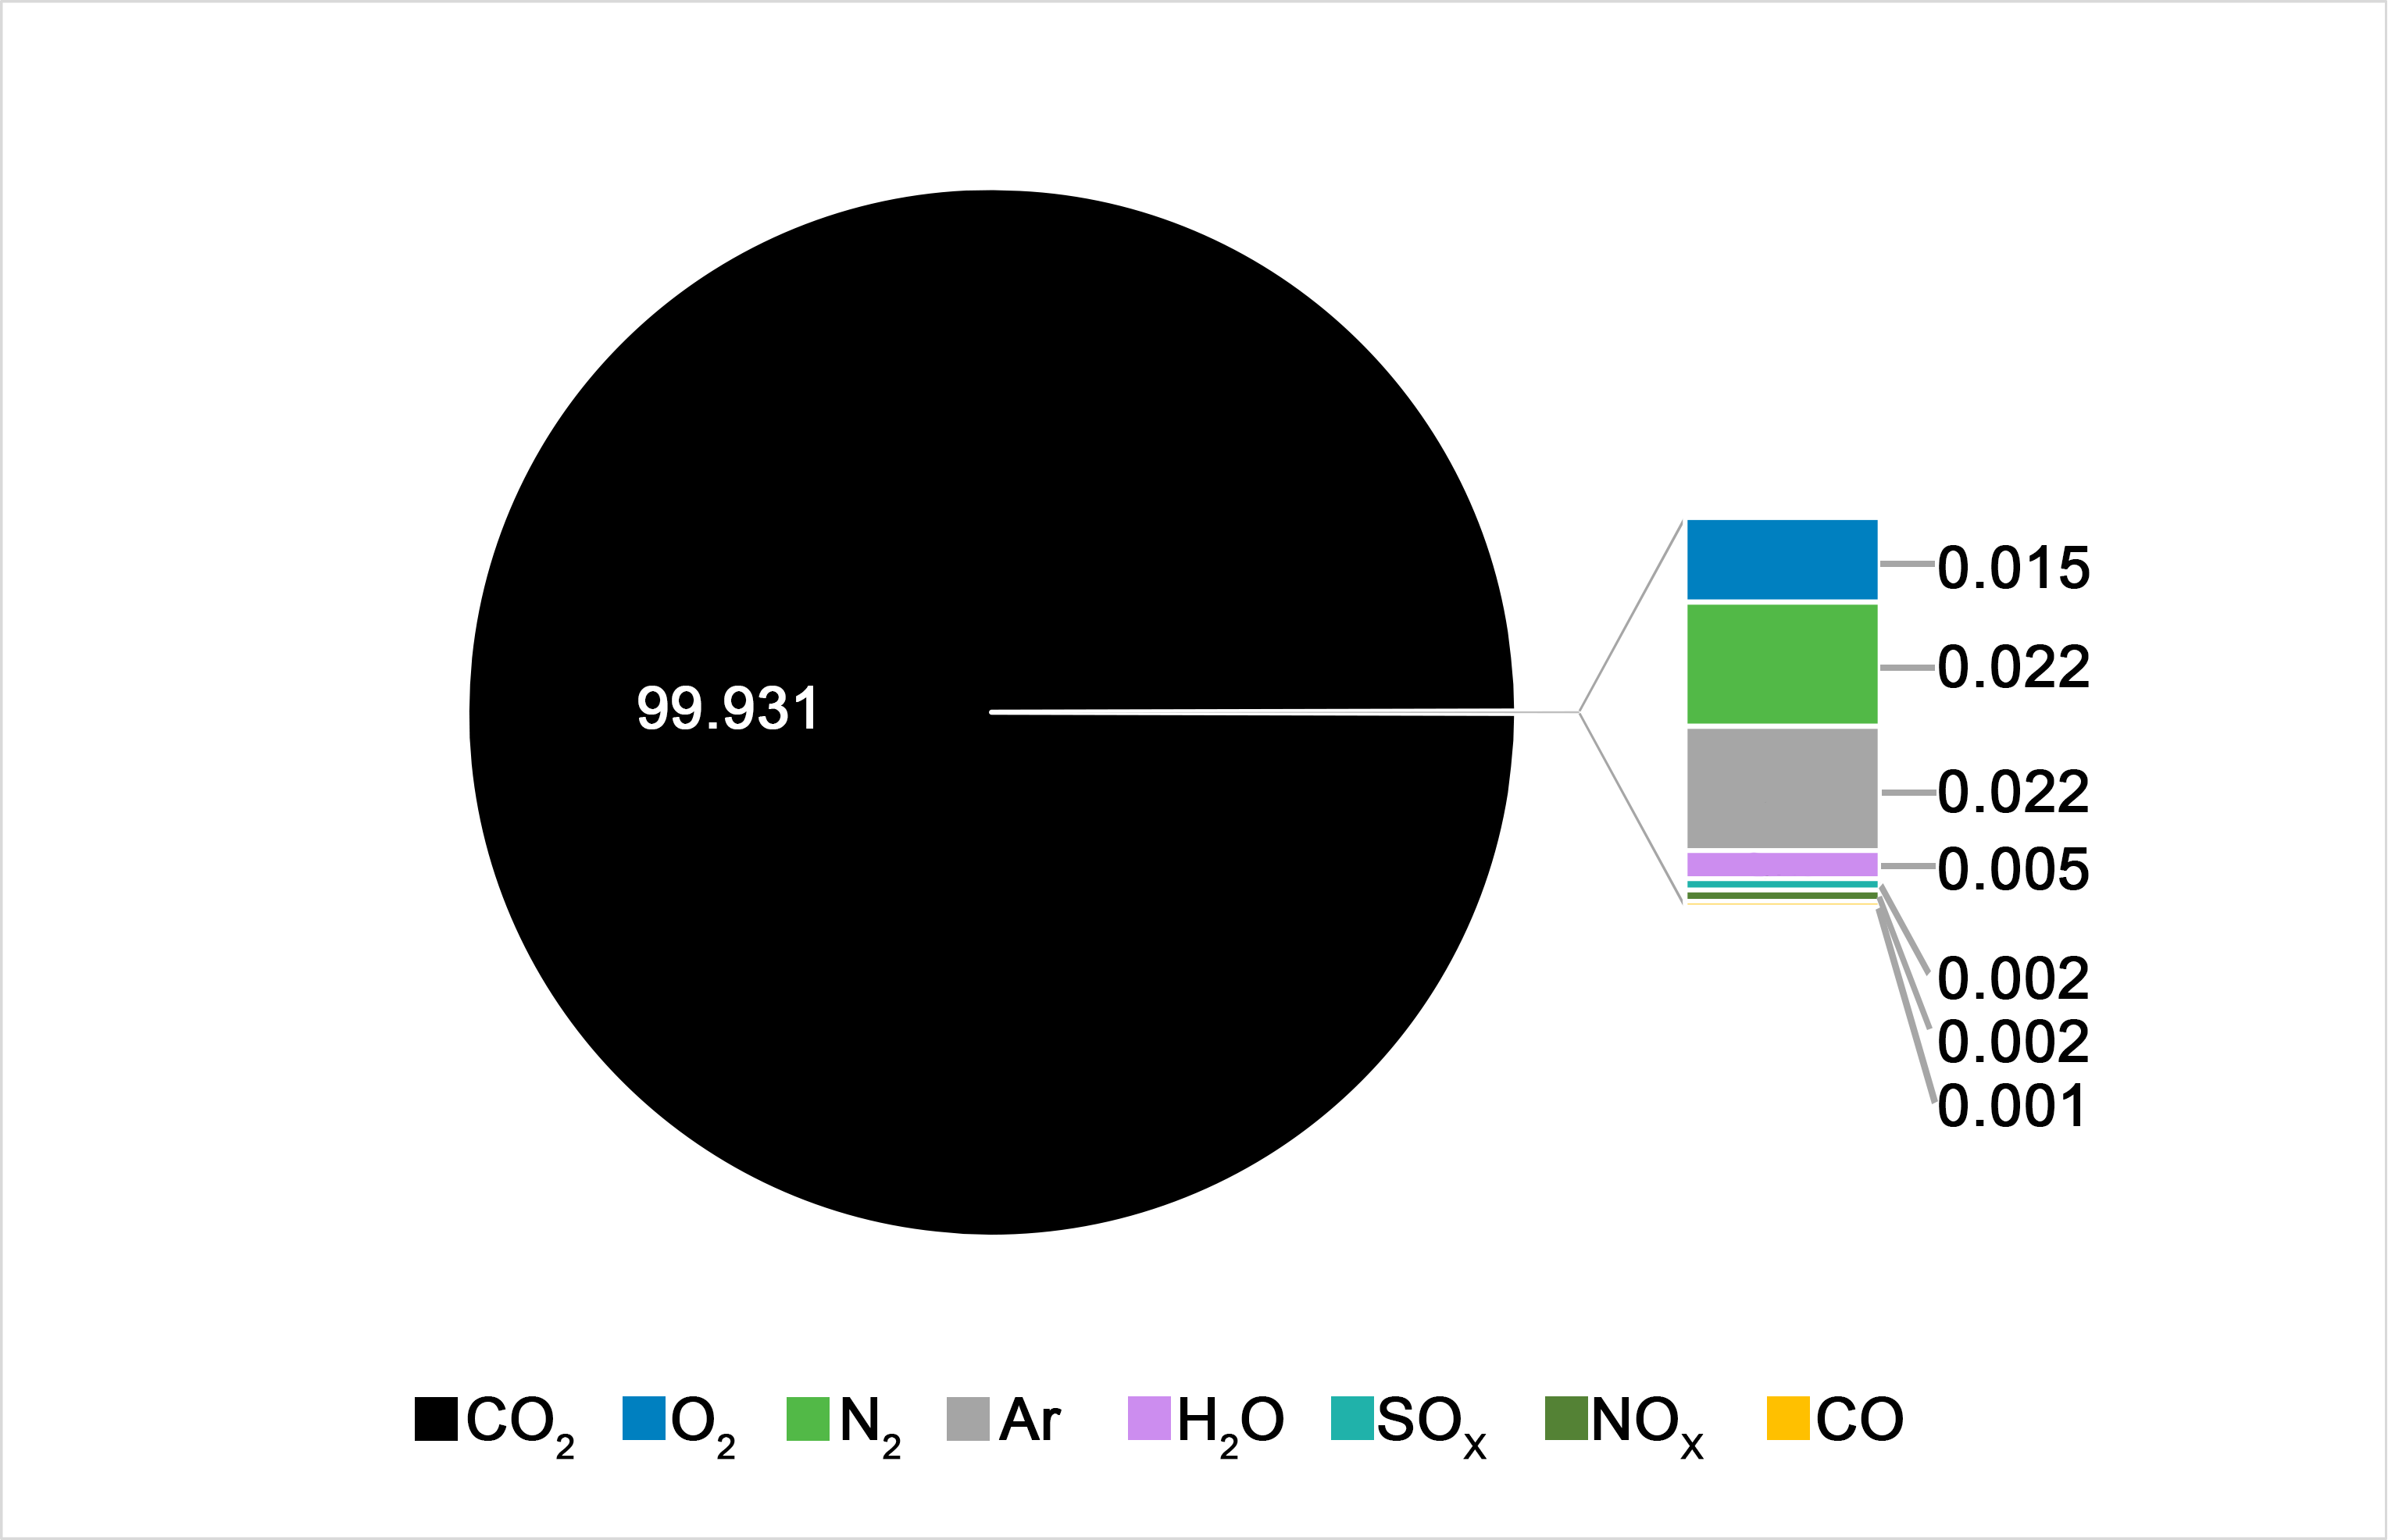 |
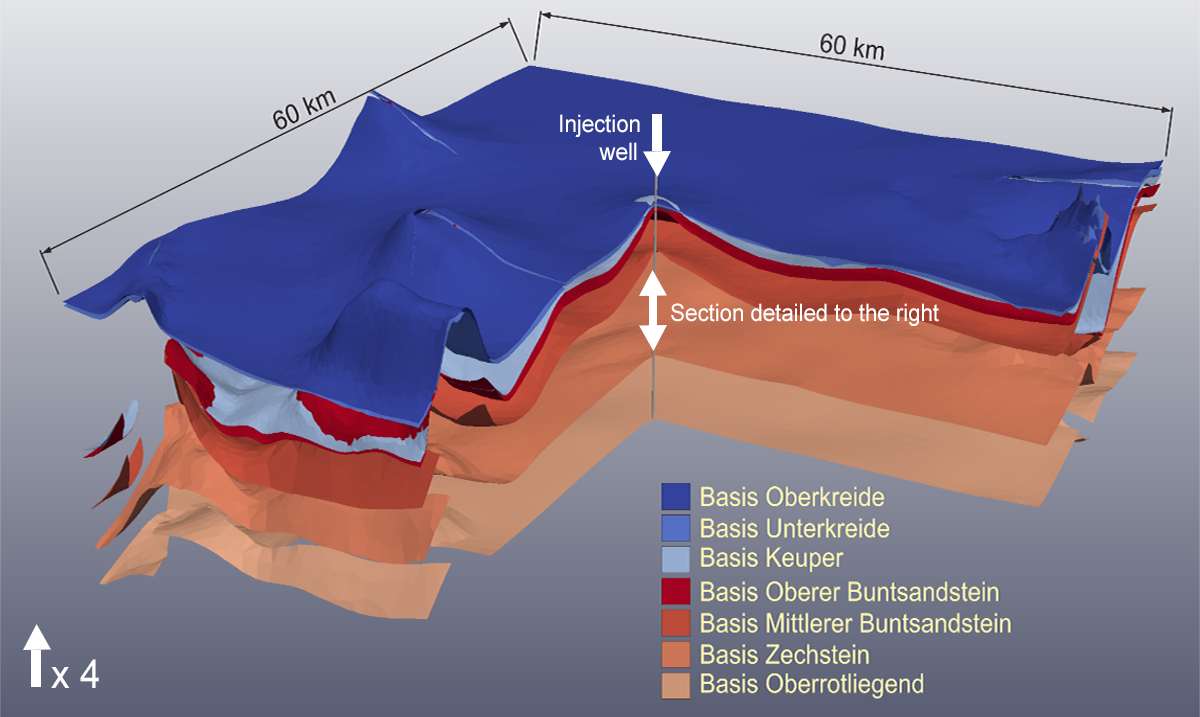
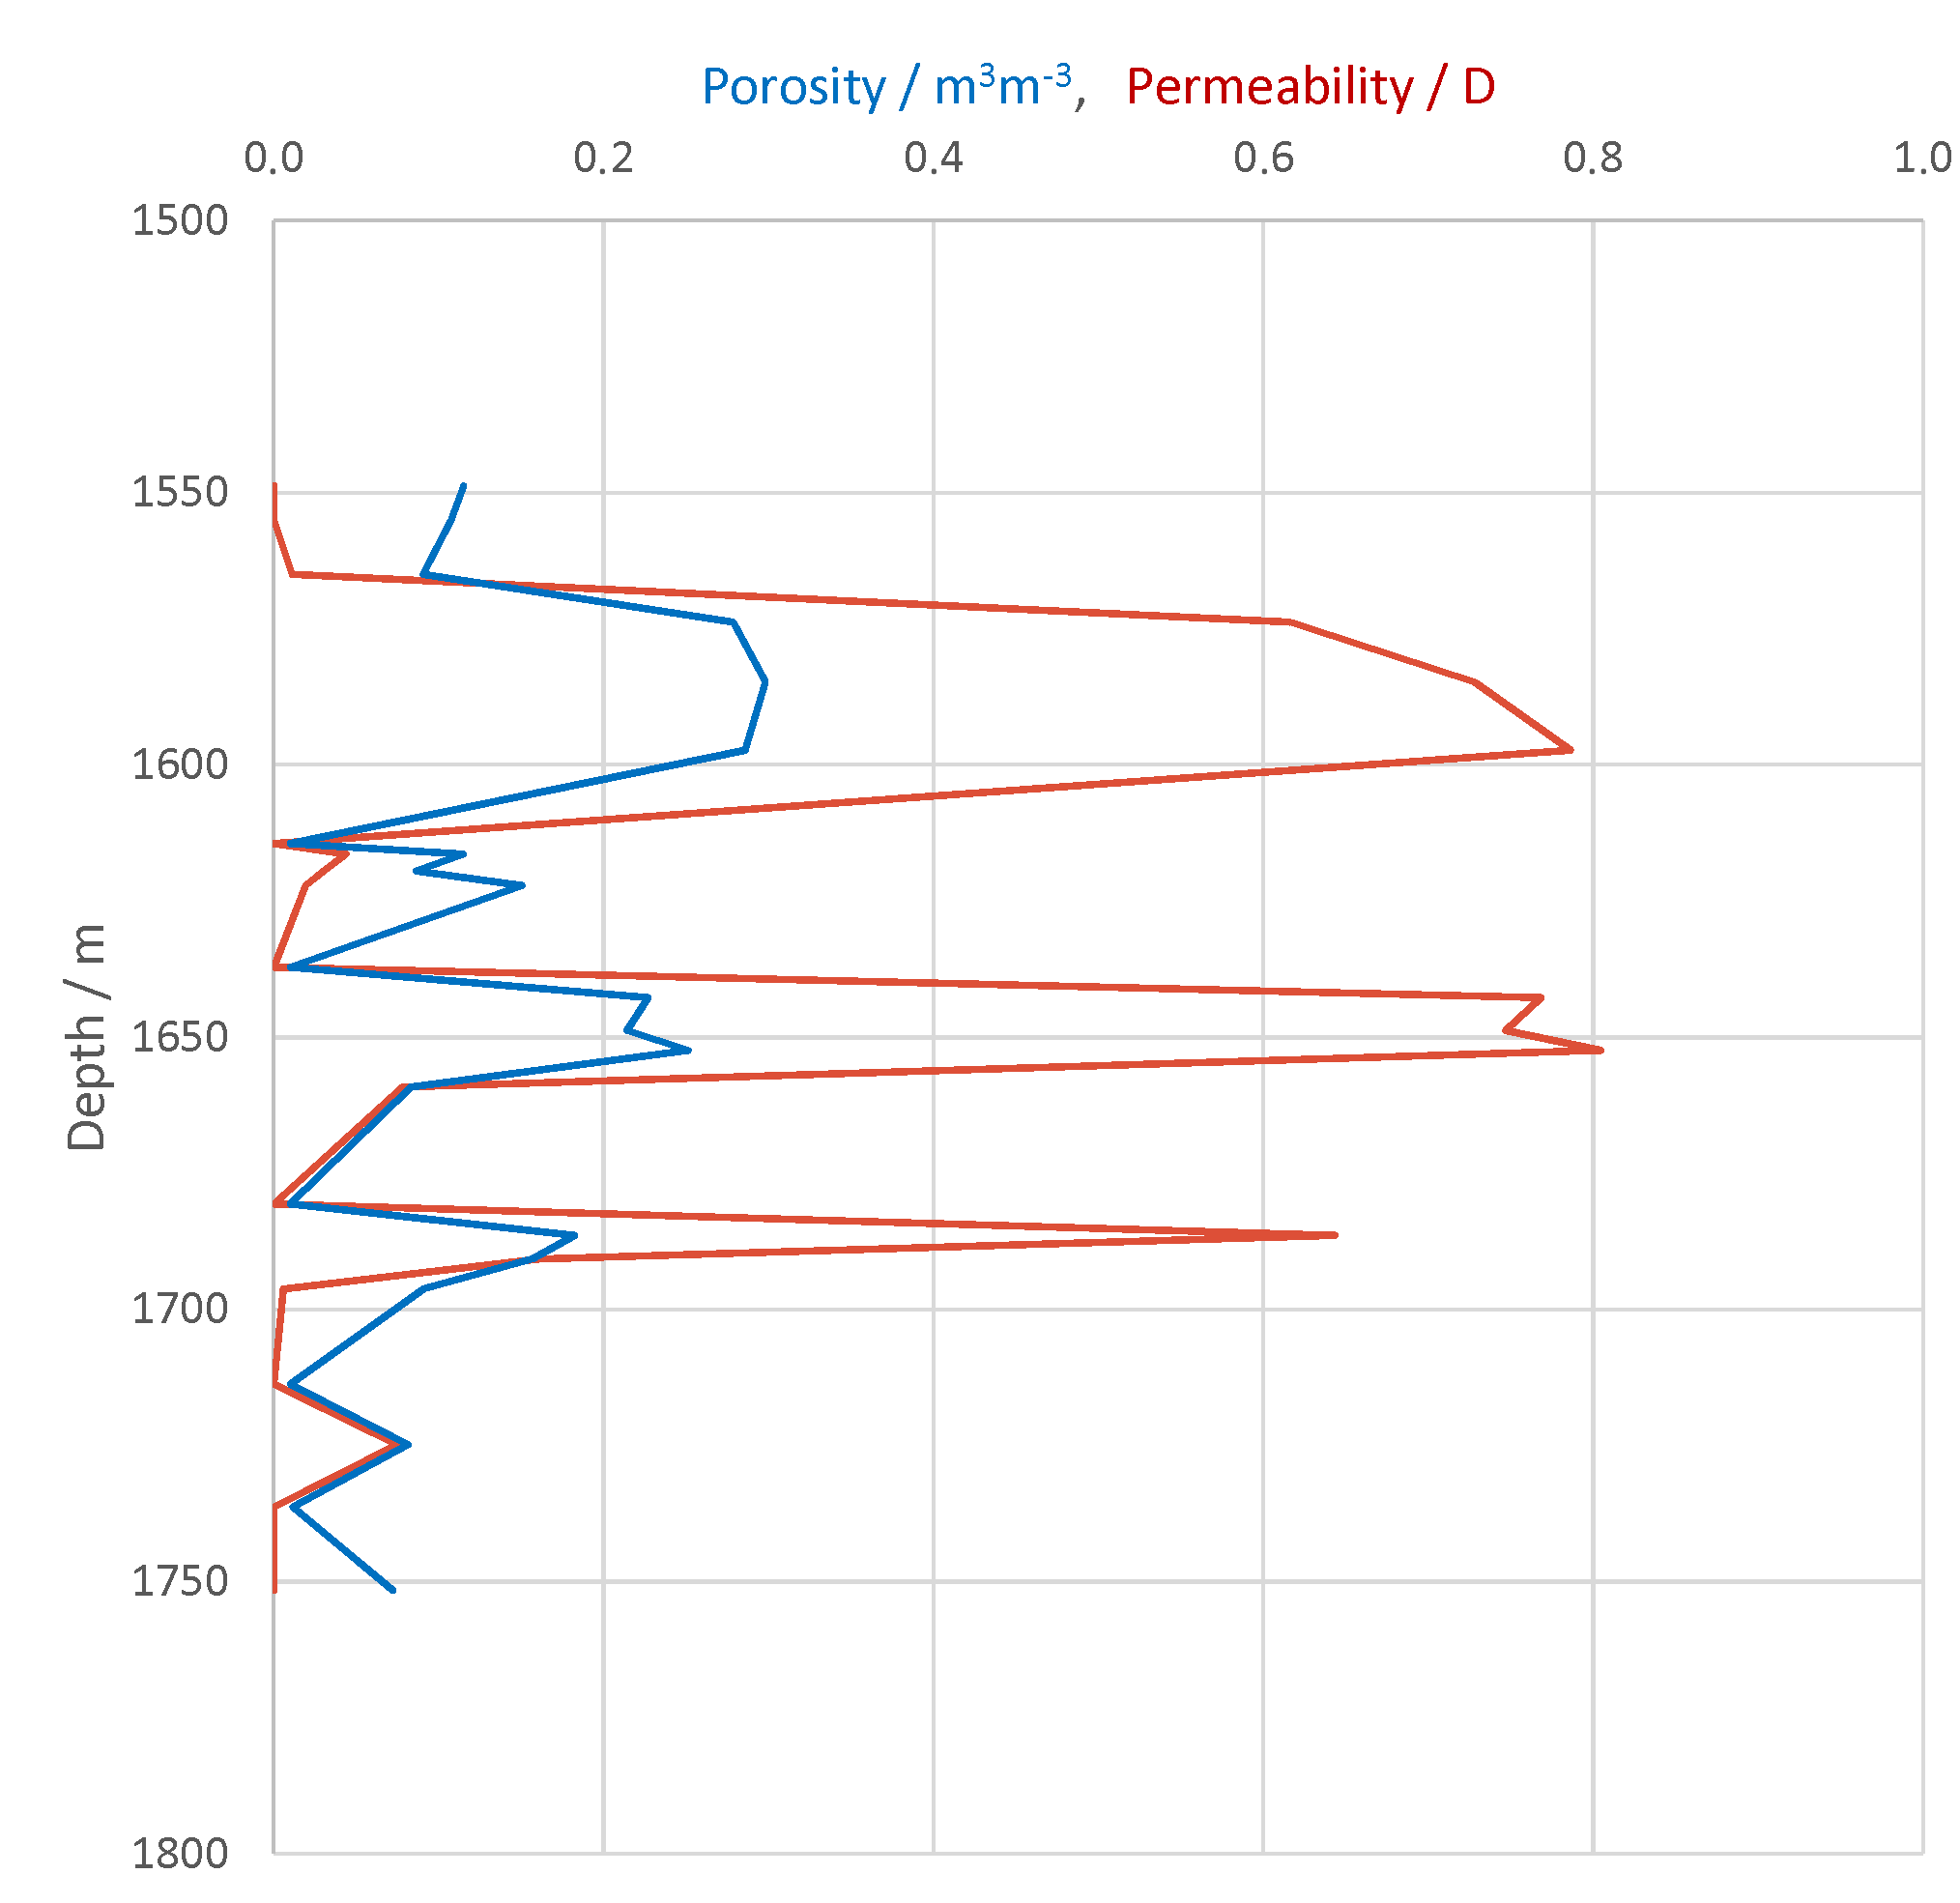
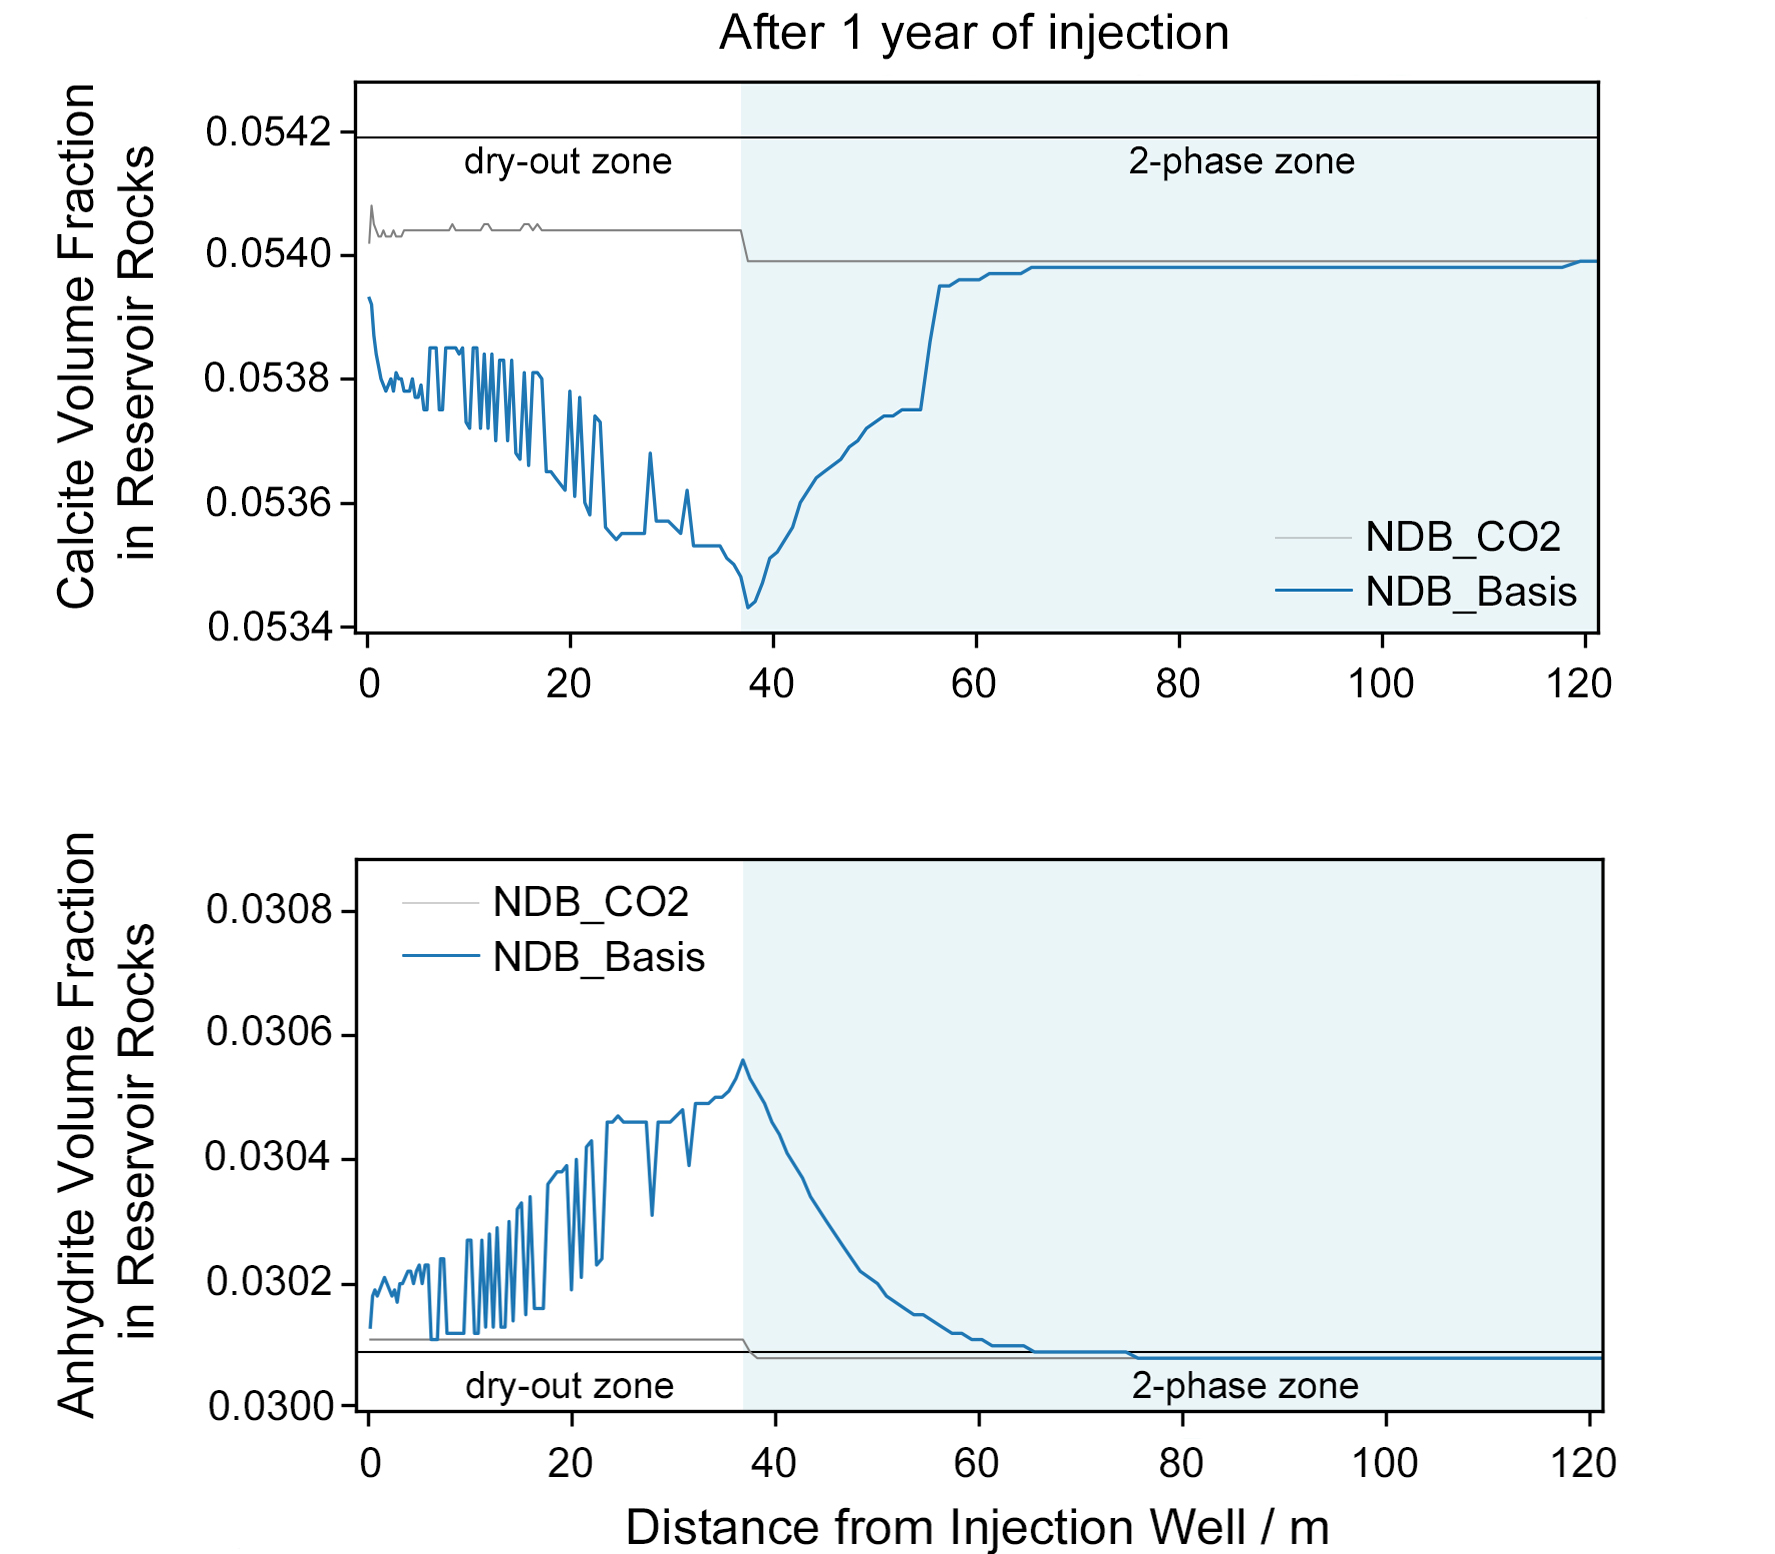
The CO2 injection scenario NDB_Basis is based a fictive sandstone with an „averaged“ composition (given as volume ratios below) calculated from sandstone compositions (Mittlerer Buntsandstein) in the North German Basin by Waldmann et al. (2014).
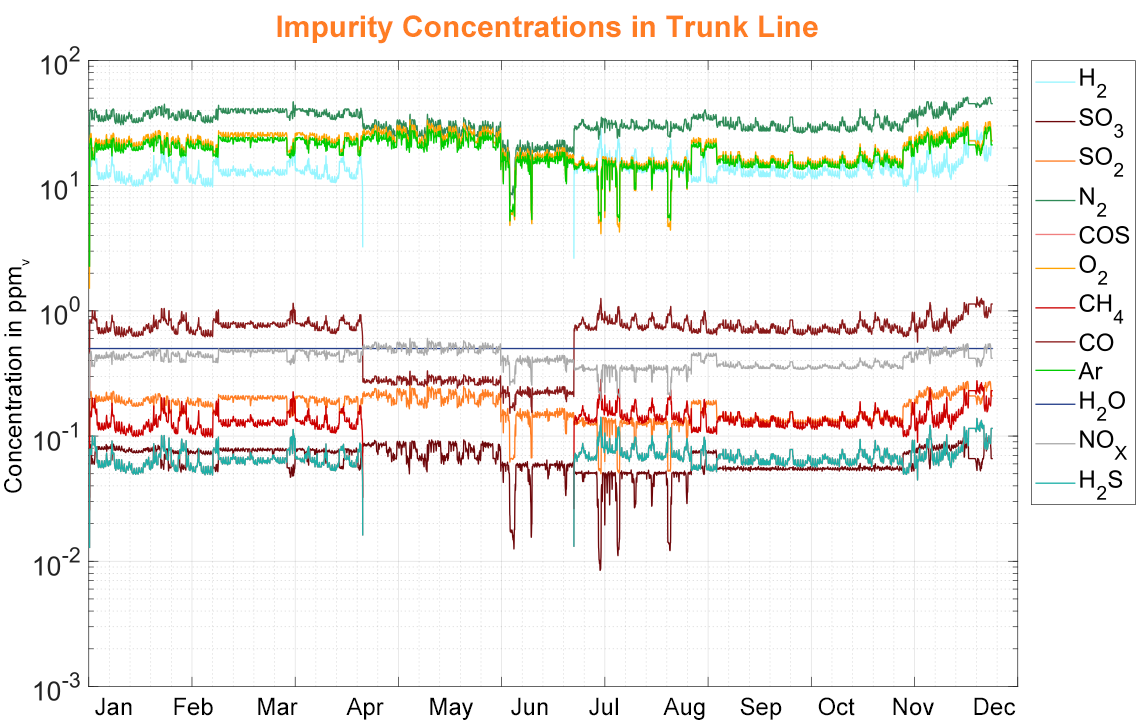
SO2, NOx, O2 and H2 were considered as impurities. Concentrations of these impurities varied according to the trunk line CO2 stream composition Annual concentration averages were: 17 ppmv SO2, 42 ppmv NO2, 2040 ppmv O2 and 1061 ppmv H2.
Other parameters used: initial reservoir temperature: 333 K, initial reservoir pressure: 16 MPa, thickness of injection horizon: 32.3 m; initial porosity: 0.287, initial permeability: 700 mDa.